

Key Insights
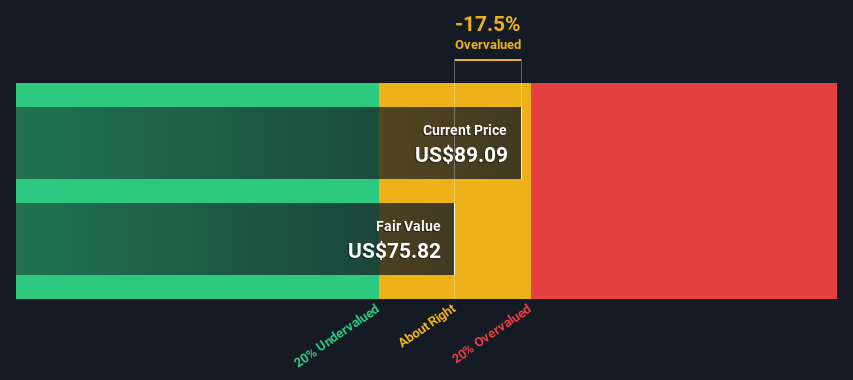
- Using the Dividend Discount Model, AGCO fair value estimate is US$75.82
- With US$89.09 share price, AGCO appears to be trading close to its estimated fair value
- Analyst price target for AGCO is US$110, which is 45% above our fair value estimate
Does the September share price for AGCO Corporation (NYSE:AGCO) reflect what it's really worth? Today, we will estimate the stock's intrinsic value by taking the expected future cash flows and discounting them to today's value. Our analysis will employ the Discounted Cash Flow (DCF) model. It may sound complicated, but actually it is quite simple!
We would caution that there are many ways of valuing a company and, like the DCF, each technique has advantages and disadvantages in certain scenarios. If you want to learn more about discounted cash flow, the rationale behind this calculation can be read in detail in the Simply Wall St analysis model.
Check out our latest analysis for AGCO
The Method
We have to calculate the value of AGCO slightly differently to other stocks because it is a machinery company. Instead of using free cash flows, which are hard to estimate and often not reported by analysts in this industry, dividends per share (DPS) payments are used. This often underestimates the value of a stock, but it can still be good as a comparison to competitors. We use the Gordon Growth Model, which assumes dividend will grow into perpetuity at a rate that can be sustained. The dividend is expected to grow at an annual growth rate equal to the 5-year average of the 10-year government bond yield of 2.5%. We then discount this figure to today's value at a cost of equity of 7.2%. Compared to the current share price of US$89.1, the company appears around fair value at the time of writing. Valuations are imprecise instruments though, rather like a telescope - move a few degrees and end up in a different galaxy. Do keep this in mind.
Value Per Share = Expected Dividend Per Share / (Discount Rate - Perpetual Growth Rate)
= US$3.6 / (7.2% – 2.5%)
= US$75.8
The Assumptions
The calculation above is very dependent on two assumptions. The first is the discount rate and the other is the cash flows. Part of investing is coming up with your own evaluation of a company's future performance, so try the calculation yourself and check your own assumptions. The DCF also does not consider the possible cyclicality of an industry, or a company's future capital requirements, so it does not give a full picture of a company's potential performance. Given that we are looking at AGCO as potential shareholders, the cost of equity is used as the discount rate, rather than the cost of capital (or weighted average cost of capital, WACC) which accounts for debt. In this calculation we've used 7.2%, which is based on a levered beta of 1.141. Beta is a measure of a stock's volatility, compared to the market as a whole. We get our beta from the industry average beta of globally comparable companies, with an imposed limit between 0.8 and 2.0, which is a reasonable range for a stable business.
SWOT Analysis for AGCO
- Debt is well covered by earnings and cashflows.
- Dividends are covered by earnings and cash flows.
- Earnings declined over the past year.
- Dividend is low compared to the top 25% of dividend payers in the Machinery market.
- Annual earnings are forecast to grow faster than the American market.
- Good value based on P/E ratio compared to estimated Fair P/E ratio.
- Significant insider buying over the past 3 months.
- Annual revenue is expected to decline over the next 3 years.
Moving On:
Whilst important, the DCF calculation shouldn't be the only metric you look at when researching a company. The DCF model is not a perfect stock valuation tool. Preferably you'd apply different cases and assumptions and see how they would impact the company's valuation. For example, changes in the company's cost of equity or the risk free rate can significantly impact the valuation. For AGCO, we've compiled three further items you should consider:
- Risks: For example, we've discovered 4 warning signs for AGCO that you should be aware of before investing here.
- Future Earnings: How does AGCO's growth rate compare to its peers and the wider market? Dig deeper into the analyst consensus number for the upcoming years by interacting with our free analyst growth expectation chart.
- Other High Quality Alternatives: Do you like a good all-rounder? Explore our interactive list of high quality stocks to get an idea of what else is out there you may be missing!
PS. Simply Wall St updates its DCF calculation for every American stock every day, so if you want to find the intrinsic value of any other stock just search here.
If you're looking to trade AGCO, open an account with the lowest-cost platform trusted by professionals, Interactive Brokers.
With clients in over 200 countries and territories, and access to 160 markets, IBKR lets you trade stocks, options, futures, forex, bonds and funds from a single integrated account.
Enjoy no hidden fees, no account minimums, and FX conversion rates as low as 0.03%, far better than what most brokers offer.
Sponsored ContentNew: Manage All Your Stock Portfolios in One Place
We've created the ultimate portfolio companion for stock investors, and it's free.
• Connect an unlimited number of Portfolios and see your total in one currency
• Be alerted to new Warning Signs or Risks via email or mobile
• Track the Fair Value of your stocks
Have feedback on this article? Concerned about the content? Get in touch with us directly. Alternatively, email editorial-team (at) simplywallst.com.
This article by Simply Wall St is general in nature. We provide commentary based on historical data and analyst forecasts only using an unbiased methodology and our articles are not intended to be financial advice. It does not constitute a recommendation to buy or sell any stock, and does not take account of your objectives, or your financial situation. We aim to bring you long-term focused analysis driven by fundamental data. Note that our analysis may not factor in the latest price-sensitive company announcements or qualitative material. Simply Wall St has no position in any stocks mentioned.
About NYSE:AGCO
AGCO
Manufactures and distributes agricultural equipment and replacement parts worldwide.
Adequate balance sheet and fair value.
Similar Companies
Market Insights

Community Narratives

