Advertisement
- United States
- /
- Trade Distributors
- /
- NasdaqGS:XMTR
How Strategic Partnerships Are Shaping Xometry’s Value After a 157.6% Stock Rally

Simply Wall St
Reviewed by Bailey Pemberton
- Ever wondered if Xometry is truly worth its ever-climbing share price, or if today's headlines are making it too easy to get swept up in the hype?
- Xometry's stock price has swung notably lately, with a 3.8% gain over the past week but a 9.6% drop in the last month. It still boasts an impressive 157.6% rise over the past year.
- Recent news around Xometry has highlighted expanding industry partnerships and strategic deals, fueling investor optimism. Many see these developments as key drivers behind the stock's sizable rally and current volatility.
- Xometry currently scores a 2/6 on our valuation checks, suggesting there is more to unpack in how this company is valued. Next, we'll break down how different valuation methods stack up. Be sure to stick around for an alternative approach that could reshape how you assess Xometry's true worth.
Xometry scores just 2/6 on our valuation checks. See what other red flags we found in the full valuation breakdown.
Approach 1: Xometry Discounted Cash Flow (DCF) Analysis
The Discounted Cash Flow (DCF) model estimates the intrinsic value of a stock by forecasting a company's future cash flows and discounting them back to their present value. This method helps investors determine what a stock should be worth based on how much cash the company is expected to generate over time.
For Xometry, the DCF analysis relies on a 2 Stage Free Cash Flow to Equity model. Currently, Xometry's last twelve months Free Cash Flow sits at -$21.35 million, reflecting its ongoing investment phase. Analysts project that by 2027, annual Free Cash Flow could rise to $30 million, with further growth extrapolated in the following years. Projections suggest Xometry's Free Cash Flow could reach as high as $268.85 million by 2035, all expressed in USD.
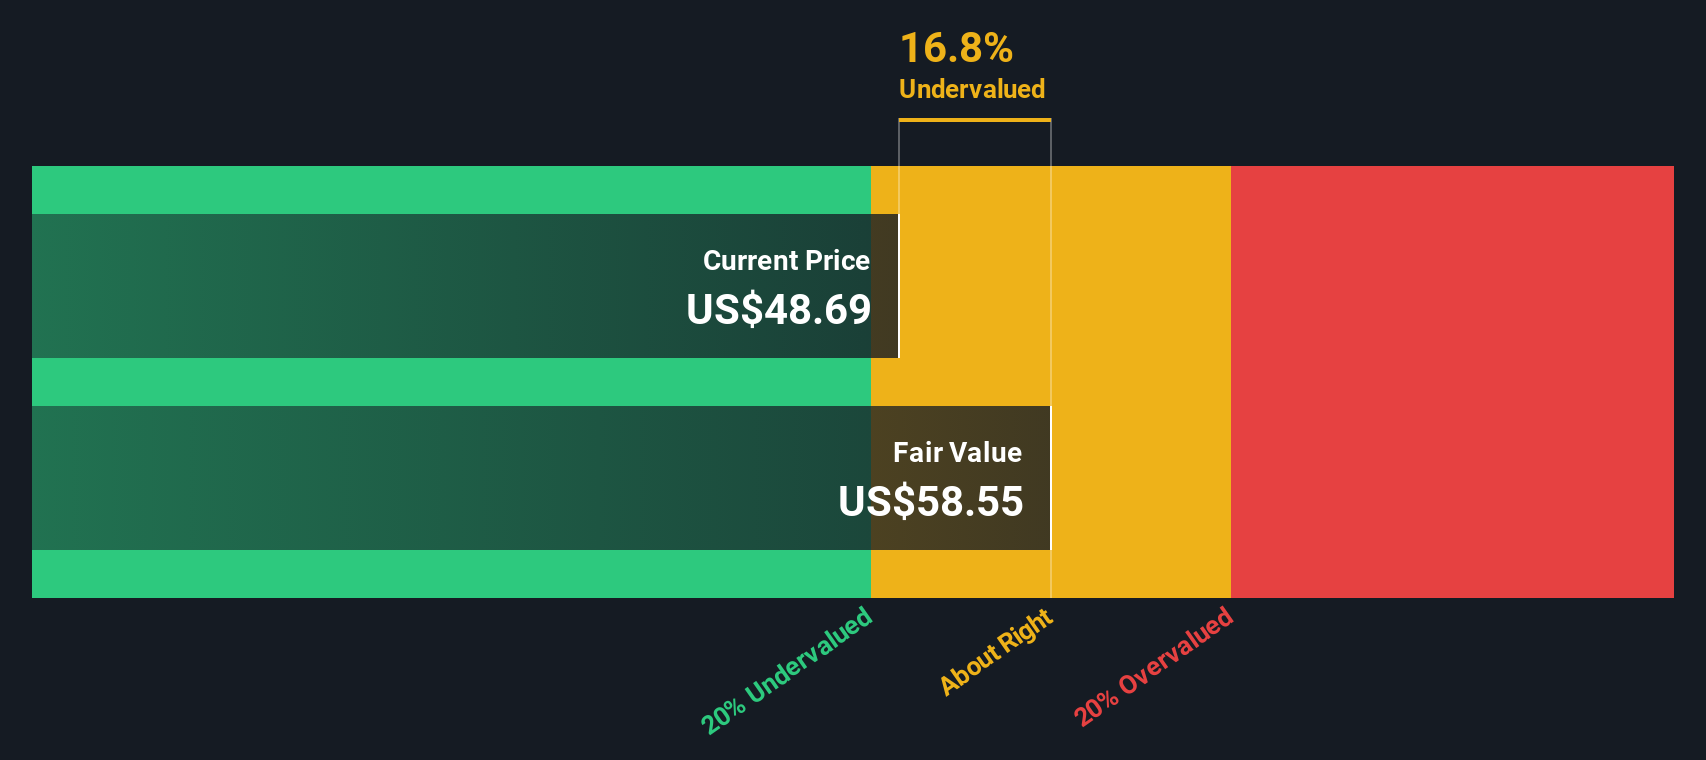
After discounting these expected future figures to today's terms, the estimated intrinsic value for Xometry stands at $65.16 per share. This figure is 22.5% higher than Xometry’s current share price, implying the stock is undervalued according to the DCF model.
Result: UNDERVALUED
Our Discounted Cash Flow (DCF) analysis suggests Xometry is undervalued by 22.5%. Track this in your watchlist or portfolio, or discover 854 more undervalued stocks based on cash flows.
Approach 2: Xometry Price vs Sales (P/S)
For companies that are not yet consistently profitable, like Xometry, the Price-to-Sales (P/S) ratio is a popular and practical valuation metric. It allows investors to benchmark the company's valuation against how much revenue it is generating, regardless of near-term earnings. In high-growth industries or for businesses still ramping up profitability, the P/S ratio can better reflect potential than traditional profit-based metrics.
It is important to note that growth expectations and risk levels help determine what a “normal” or “fair” P/S ratio should be. Faster-growing companies with significant future sales potential typically justify higher multiples, while greater risks or uncertainty can temper what investors are willing to pay.
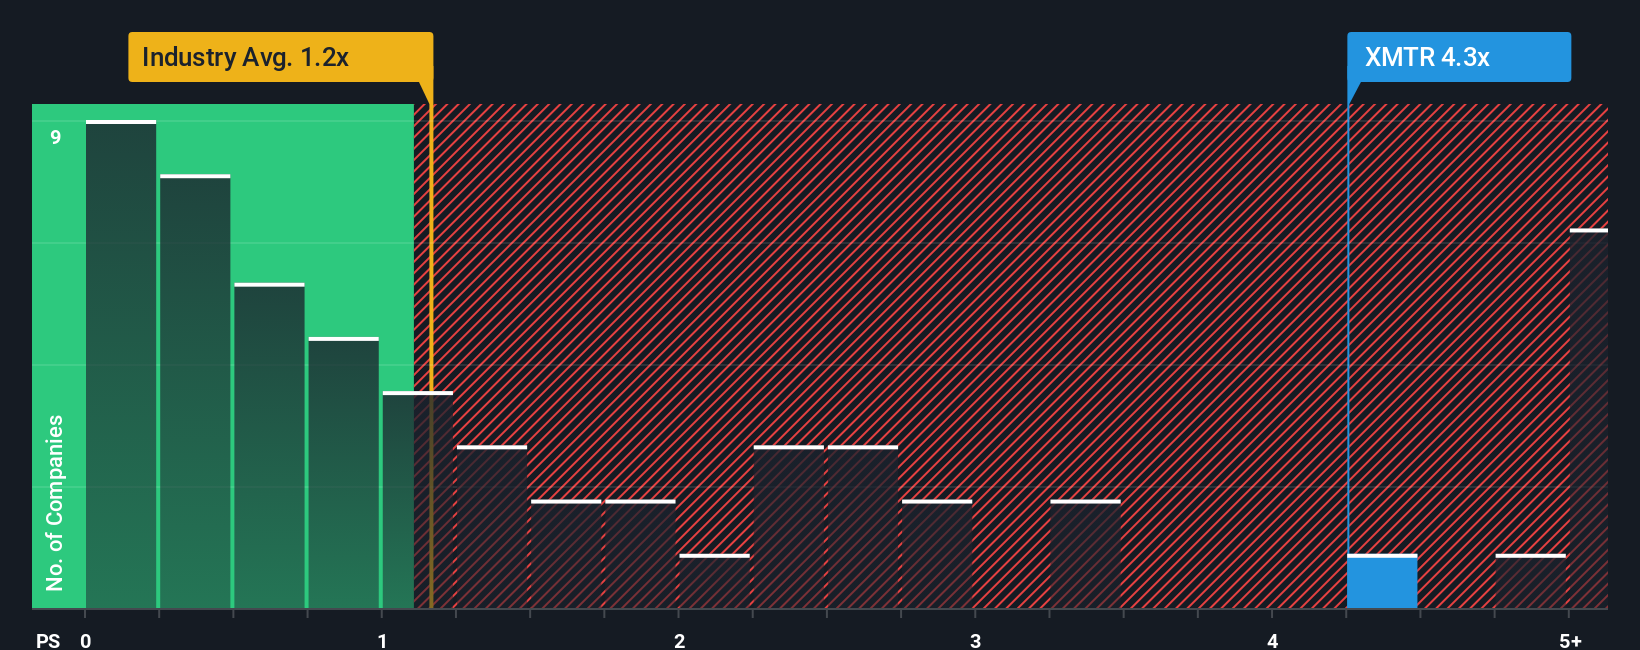
Xometry currently trades at a P/S ratio of 4.25x, well above the Trade Distributors industry average of 1.13x and the peer average of 1.45x. While this initially suggests Xometry is expensive compared to its sector, there is more to the story.
This is where Simply Wall St’s “Fair Ratio” comes in. The Fair Ratio, calculated at 3.16x, is a proprietary metric combining factors like the company's expected growth, profitability, risk profile, industry context, and market cap. Unlike industry or peer comparisons, which can be skewed if peer companies are at different growth stages, the Fair Ratio aims to provide a more nuanced benchmark tailored to Xometry’s unique outlook and characteristics.
Comparing Xometry’s current P/S of 4.25x to its Fair Ratio of 3.16x suggests the stock is trading somewhat above its fundamental value using this metric, and therefore may be considered overvalued at present.
Result: OVERVALUED
PS ratios tell one story, but what if the real opportunity lies elsewhere? Discover 1395 companies where insiders are betting big on explosive growth.
Upgrade Your Decision Making: Choose your Xometry Narrative
Earlier we mentioned that there is an even better way to understand valuation, so let us introduce you to Narratives. A Narrative is simply your own story and perspective about a company, connecting the reasons behind your fair value with what you believe about its future revenue, earnings, and margins.
Unlike traditional valuation models, Narratives give you the power to link a company’s background and prospects directly to a financial forecast, then to a personal fair value estimate. They are easy to create and accessible right on Simply Wall St’s Community page, used by millions of investors looking to compare different viewpoints.
With Narratives, you can actively decide whether to buy or sell Xometry by weighing your own Fair Value against the current share price. Whenever new news, earnings, or major developments come in, Narratives are updated dynamically so your viewpoint always reflects the latest company events.
For example, one investor’s Narrative for Xometry might focus on its rapid AI-driven growth and set a fair value as high as $55.00, while another, more cautious Narrative could emphasize persistent operating risks and arrive at a much lower fair value of $40.00. This highlights just how personal, practical, and actionable Narratives are in guiding your next move.
Do you think there's more to the story for Xometry? Head over to our Community to see what others are saying!

This article by Simply Wall St is general in nature. We provide commentary based on historical data and analyst forecasts only using an unbiased methodology and our articles are not intended to be financial advice. It does not constitute a recommendation to buy or sell any stock, and does not take account of your objectives, or your financial situation. We aim to bring you long-term focused analysis driven by fundamental data. Note that our analysis may not factor in the latest price-sensitive company announcements or qualitative material. Simply Wall St has no position in any stocks mentioned.
New: AI Stock Screener & Alerts
Our new AI Stock Screener scans the market every day to uncover opportunities.
• Dividend Powerhouses (3%+ Yield)
• Undervalued Small Caps with Insider Buying
• High growth Tech and AI Companies
Or build your own from over 50 metrics.
Have feedback on this article? Concerned about the content? Get in touch with us directly. Alternatively, email editorial-team@simplywallst.com
About NasdaqGS:XMTR
Xometry
Operates an artificial intelligence (AI) powered online manufacturing marketplace in the United States and internationally.
Mediocre balance sheet and slightly overvalued.
Similar Companies
Market Insights

Advertisement
Community Narratives
The company that turned a verb into a global necessity and basically runs the modern internet, digital ads, smartphones, maps, and AI.
Fair Value US$300.00|8.5% undervalued
OS
Community Contributor
Flowers Foods Pays A Fair Price For Health
Fair Value US$16.12|24.6% undervalued
NV
Community Contributor
TMX Group will thrive with 33.3% profit margin and enduring market moat
Fair Value CA$49.90|0.1% undervalued
LI
Community Contributor