Stock Analysis
- United States
- /
- Trade Distributors
- /
- NasdaqGS:RUSH.A
Rush Enterprises' (NASDAQ:RUSH.A) 25% CAGR outpaced the company's earnings growth over the same five-year period


When you buy a stock there is always a possibility that it could drop 100%. But on a lighter note, a good company can see its share price rise well over 100%. One great example is Rush Enterprises, Inc. (NASDAQ:RUSH.A) which saw its share price drive 188% higher over five years. Better yet, the share price has risen 6.5% in the last week. The company reported its financial results recently; you can catch up on the latest numbers by reading our company report.
The past week has proven to be lucrative for Rush Enterprises investors, so let's see if fundamentals drove the company's five-year performance.
See our latest analysis for Rush Enterprises
While markets are a powerful pricing mechanism, share prices reflect investor sentiment, not just underlying business performance. One flawed but reasonable way to assess how sentiment around a company has changed is to compare the earnings per share (EPS) with the share price.
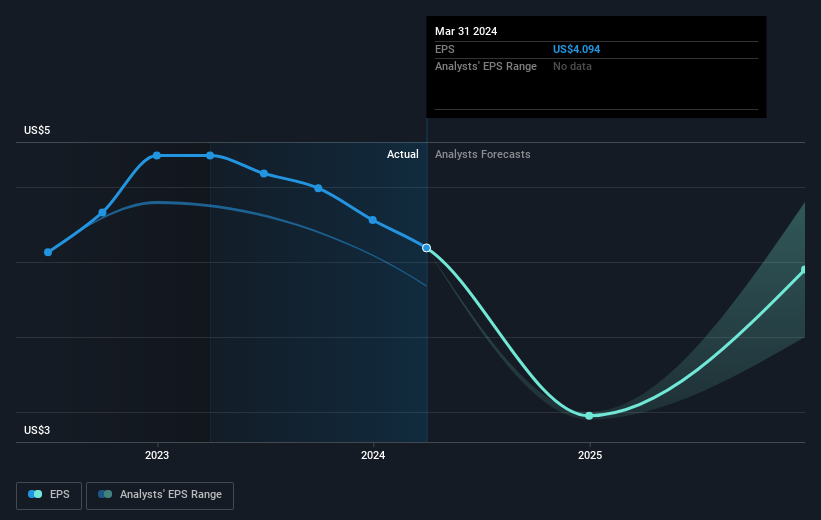
Over half a decade, Rush Enterprises managed to grow its earnings per share at 18% a year. This EPS growth is slower than the share price growth of 24% per year, over the same period. This suggests that market participants hold the company in higher regard, these days. And that's hardly shocking given the track record of growth.
The graphic below depicts how EPS has changed over time (unveil the exact values by clicking on the image).
We know that Rush Enterprises has improved its bottom line over the last three years, but what does the future have in store? This free interactive report on Rush Enterprises' balance sheet strength is a great place to start, if you want to investigate the stock further.
What About Dividends?
As well as measuring the share price return, investors should also consider the total shareholder return (TSR). The TSR incorporates the value of any spin-offs or discounted capital raisings, along with any dividends, based on the assumption that the dividends are reinvested. Arguably, the TSR gives a more comprehensive picture of the return generated by a stock. As it happens, Rush Enterprises' TSR for the last 5 years was 210%, which exceeds the share price return mentioned earlier. And there's no prize for guessing that the dividend payments largely explain the divergence!
A Different Perspective
It's nice to see that Rush Enterprises shareholders have received a total shareholder return of 36% over the last year. That's including the dividend. That's better than the annualised return of 25% over half a decade, implying that the company is doing better recently. Someone with an optimistic perspective could view the recent improvement in TSR as indicating that the business itself is getting better with time. I find it very interesting to look at share price over the long term as a proxy for business performance. But to truly gain insight, we need to consider other information, too. Case in point: We've spotted 2 warning signs for Rush Enterprises you should be aware of.
If you like to buy stocks alongside management, then you might just love this free list of companies. (Hint: insiders have been buying them).
Please note, the market returns quoted in this article reflect the market weighted average returns of stocks that currently trade on American exchanges.
Valuation is complex, but we're helping make it simple.
Find out whether Rush Enterprises is potentially over or undervalued by checking out our comprehensive analysis, which includes fair value estimates, risks and warnings, dividends, insider transactions and financial health.
View the Free AnalysisHave feedback on this article? Concerned about the content? Get in touch with us directly. Alternatively, email editorial-team (at) simplywallst.com.
This article by Simply Wall St is general in nature. We provide commentary based on historical data and analyst forecasts only using an unbiased methodology and our articles are not intended to be financial advice. It does not constitute a recommendation to buy or sell any stock, and does not take account of your objectives, or your financial situation. We aim to bring you long-term focused analysis driven by fundamental data. Note that our analysis may not factor in the latest price-sensitive company announcements or qualitative material. Simply Wall St has no position in any stocks mentioned.
About NasdaqGS:RUSH.A
Rush Enterprises
Through its subsidiaries, operates as an integrated retailer of commercial vehicles and related services in the United States and Canada.
Adequate balance sheet and fair value.
