
Some say volatility, rather than debt, is the best way to think about risk as an investor, but Warren Buffett famously said that 'Volatility is far from synonymous with risk.' When we think about how risky a company is, we always like to look at its use of debt, since debt overload can lead to ruin. As with many other companies Richtech Robotics Inc. (NASDAQ:RR) makes use of debt. But is this debt a concern to shareholders?
Why Does Debt Bring Risk?
Debt is a tool to help businesses grow, but if a business is incapable of paying off its lenders, then it exists at their mercy. In the worst case scenario, a company can go bankrupt if it cannot pay its creditors. However, a more frequent (but still costly) occurrence is where a company must issue shares at bargain-basement prices, permanently diluting shareholders, just to shore up its balance sheet. Of course, plenty of companies use debt to fund growth, without any negative consequences. The first step when considering a company's debt levels is to consider its cash and debt together.
Check out our latest analysis for Richtech Robotics
How Much Debt Does Richtech Robotics Carry?
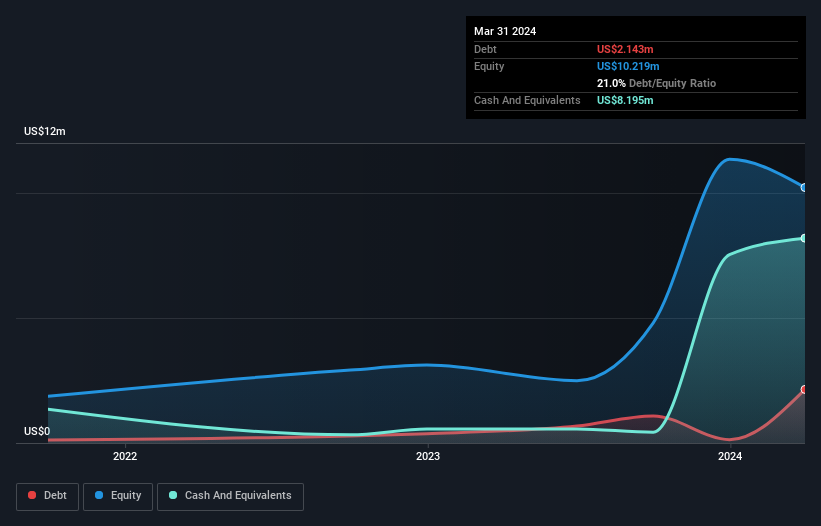
You can click the graphic below for the historical numbers, but it shows that as of March 2024 Richtech Robotics had US$2.14m of debt, an increase on US$681.0k, over one year. But it also has US$8.20m in cash to offset that, meaning it has US$6.05m net cash.
How Healthy Is Richtech Robotics' Balance Sheet?
We can see from the most recent balance sheet that Richtech Robotics had liabilities of US$2.91m falling due within a year, and liabilities of US$91.0k due beyond that. Offsetting this, it had US$8.20m in cash and US$3.92m in receivables that were due within 12 months. So it actually has US$9.12m more liquid assets than total liabilities.
This short term liquidity is a sign that Richtech Robotics could probably pay off its debt with ease, as its balance sheet is far from stretched. Simply put, the fact that Richtech Robotics has more cash than debt is arguably a good indication that it can manage its debt safely. There's no doubt that we learn most about debt from the balance sheet. But it is Richtech Robotics's earnings that will influence how the balance sheet holds up in the future. So when considering debt, it's definitely worth looking at the earnings trend. Click here for an interactive snapshot.
In the last year Richtech Robotics wasn't profitable at an EBIT level, but managed to grow its revenue by 31%, to US$9.0m. Shareholders probably have their fingers crossed that it can grow its way to profits.
So How Risky Is Richtech Robotics?
Statistically speaking companies that lose money are riskier than those that make money. And in the last year Richtech Robotics had an earnings before interest and tax (EBIT) loss, truth be told. Indeed, in that time it burnt through US$3.8m of cash and made a loss of US$2.3m. But at least it has US$6.05m on the balance sheet to spend on growth, near-term. Richtech Robotics's revenue growth shone bright over the last year, so it may well be in a position to turn a profit in due course. By investing before those profits, shareholders take on more risk in the hope of bigger rewards. The balance sheet is clearly the area to focus on when you are analysing debt. But ultimately, every company can contain risks that exist outside of the balance sheet. For example - Richtech Robotics has 2 warning signs we think you should be aware of.
If, after all that, you're more interested in a fast growing company with a rock-solid balance sheet, then check out our list of net cash growth stocks without delay.
The New Payments ETF Is Live on NASDAQ:
Money is moving to real-time rails, and a newly listed ETF now gives investors direct exposure. Fast settlement. Institutional custody. Simple access.
Explore how this launch could reshape portfolios
Sponsored ContentNew: AI Stock Screener & Alerts
Our new AI Stock Screener scans the market every day to uncover opportunities.
• Dividend Powerhouses (3%+ Yield)
• Undervalued Small Caps with Insider Buying
• High growth Tech and AI Companies
Or build your own from over 50 metrics.
Have feedback on this article? Concerned about the content? Get in touch with us directly. Alternatively, email editorial-team (at) simplywallst.com.
This article by Simply Wall St is general in nature. We provide commentary based on historical data and analyst forecasts only using an unbiased methodology and our articles are not intended to be financial advice. It does not constitute a recommendation to buy or sell any stock, and does not take account of your objectives, or your financial situation. We aim to bring you long-term focused analysis driven by fundamental data. Note that our analysis may not factor in the latest price-sensitive company announcements or qualitative material. Simply Wall St has no position in any stocks mentioned.
About NasdaqCM:RR
Richtech Robotics
Develops, manufactures, deploys, and sells robotic solutions for automation in the service industry in the United States.
Flawless balance sheet with medium-low risk.
Market Insights

Weekly Picks

Early mover in a fast growing industry. Likely to experience share price volatility as they scale


A case for CA$31.80 (undiluted), aka 8,616% upside from CA$0.37 (an 86 bagger!).


Moderation and Stabilisation: HOLD: Fair Price based on a 4-year Cycle is $12.08
Recently Updated Narratives


Title: Market Sentiment Is Dead Wrong — Here's Why PSEC Deserves a Second Look


An amazing opportunity to potentially get a 100 bagger

Amazon: Why the World’s Biggest Platform Still Runs on Invisible Economics
Popular Narratives


Crazy Undervalued 42 Baggers Silver Play (Active & Running Mine)


MicroVision will explode future revenue by 380.37% with a vision towards success


NVDA: Expanding AI Demand Will Drive Major Data Center Investments Through 2026
Trending Discussion
