
Advertisement

David Iben put it well when he said, 'Volatility is not a risk we care about. What we care about is avoiding the permanent loss of capital.' So it might be obvious that you need to consider debt, when you think about how risky any given stock is, because too much debt can sink a company. As with many other companies Nordson Corporation (NASDAQ:NDSN) makes use of debt. But should shareholders be worried about its use of debt?
When Is Debt Dangerous?
Debt assists a business until the business has trouble paying it off, either with new capital or with free cash flow. If things get really bad, the lenders can take control of the business. However, a more usual (but still expensive) situation is where a company must dilute shareholders at a cheap share price simply to get debt under control. Of course, the upside of debt is that it often represents cheap capital, especially when it replaces dilution in a company with the ability to reinvest at high rates of return. The first thing to do when considering how much debt a business uses is to look at its cash and debt together.
See our latest analysis for Nordson
What Is Nordson's Debt?
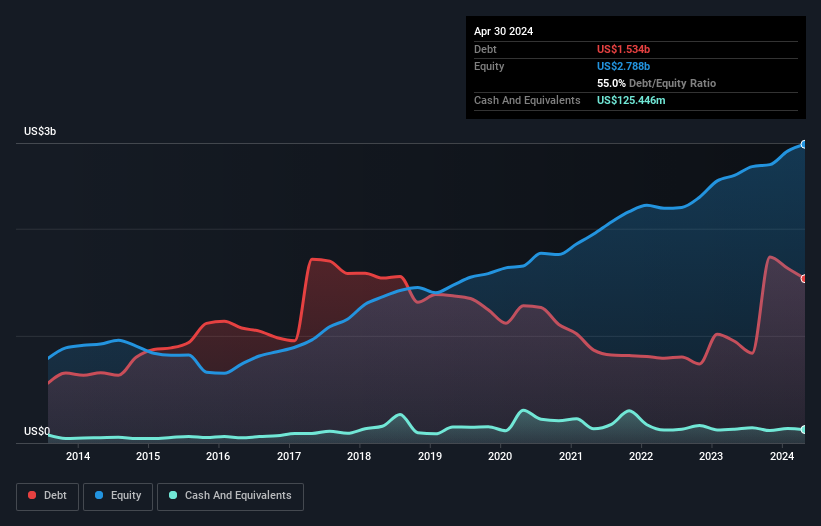
The image below, which you can click on for greater detail, shows that at April 2024 Nordson had debt of US$1.53b, up from US$949.2m in one year. However, because it has a cash reserve of US$125.4m, its net debt is less, at about US$1.41b.
A Look At Nordson's Liabilities
The latest balance sheet data shows that Nordson had liabilities of US$536.0m due within a year, and liabilities of US$1.85b falling due after that. Offsetting these obligations, it had cash of US$125.4m as well as receivables valued at US$530.3m due within 12 months. So it has liabilities totalling US$1.73b more than its cash and near-term receivables, combined.
Of course, Nordson has a titanic market capitalization of US$13.2b, so these liabilities are probably manageable. Having said that, it's clear that we should continue to monitor its balance sheet, lest it change for the worse.
We measure a company's debt load relative to its earnings power by looking at its net debt divided by its earnings before interest, tax, depreciation, and amortization (EBITDA) and by calculating how easily its earnings before interest and tax (EBIT) cover its interest expense (interest cover). The advantage of this approach is that we take into account both the absolute quantum of debt (with net debt to EBITDA) and the actual interest expenses associated with that debt (with its interest cover ratio).
Nordson's net debt of 1.7 times EBITDA suggests graceful use of debt. And the fact that its trailing twelve months of EBIT was 9.1 times its interest expenses harmonizes with that theme. Nordson grew its EBIT by 7.2% in the last year. That's far from incredible but it is a good thing, when it comes to paying off debt. The balance sheet is clearly the area to focus on when you are analysing debt. But it is future earnings, more than anything, that will determine Nordson's ability to maintain a healthy balance sheet going forward. So if you're focused on the future you can check out this free report showing analyst profit forecasts.
Finally, a company can only pay off debt with cold hard cash, not accounting profits. So the logical step is to look at the proportion of that EBIT that is matched by actual free cash flow. Over the last three years, Nordson recorded free cash flow worth a fulsome 80% of its EBIT, which is stronger than we'd usually expect. That positions it well to pay down debt if desirable to do so.
Our View
The good news is that Nordson's demonstrated ability to convert EBIT to free cash flow delights us like a fluffy puppy does a toddler. And the good news does not stop there, as its interest cover also supports that impression! When we consider the range of factors above, it looks like Nordson is pretty sensible with its use of debt. While that brings some risk, it can also enhance returns for shareholders. When analysing debt levels, the balance sheet is the obvious place to start. However, not all investment risk resides within the balance sheet - far from it. For example - Nordson has 1 warning sign we think you should be aware of.
At the end of the day, it's often better to focus on companies that are free from net debt. You can access our special list of such companies (all with a track record of profit growth). It's free.
Valuation is complex, but we're here to simplify it.
Discover if Nordson might be undervalued or overvalued with our detailed analysis, featuring fair value estimates, potential risks, dividends, insider trades, and its financial condition.
Access Free AnalysisHave feedback on this article? Concerned about the content? Get in touch with us directly. Alternatively, email editorial-team (at) simplywallst.com.
This article by Simply Wall St is general in nature. We provide commentary based on historical data and analyst forecasts only using an unbiased methodology and our articles are not intended to be financial advice. It does not constitute a recommendation to buy or sell any stock, and does not take account of your objectives, or your financial situation. We aim to bring you long-term focused analysis driven by fundamental data. Note that our analysis may not factor in the latest price-sensitive company announcements or qualitative material. Simply Wall St has no position in any stocks mentioned.
Have feedback on this article? Concerned about the content? Get in touch with us directly. Alternatively, email editorial-team@simplywallst.com
About NasdaqGS:NDSN
Nordson
Nordson Corporation engineers, manufactures, and markets products and systems to dispense, apply, and control adhesives, coatings, polymers, sealants, biomaterials, and other fluids.
Adequate balance sheet average dividend payer.
Similar Companies
Market Insights

Advertisement
Community Narratives
Pinterest will surge as advertising innovations ignite revenue growth
Fair Value US$42.63|27.0% undervalued
BR
Community Contributor
Brambles' Revenue Set to Climb 14% with Profit Margins Following
Fair Value AU$21.90|5.9% overvalued
RO
Community Contributor
Challenging Future for STG as Organic Sales Decline by 8.8%
Fair Value DKK 116.13|26.8% undervalued
KA
Community Contributor