
Advertisement
- United States
- /
- Construction
- /
- NasdaqGS:MYRG
MYR Group's (NASDAQ:MYRG) Returns On Capital Are Heading Higher
If you're looking for a multi-bagger, there's a few things to keep an eye out for. One common approach is to try and find a company with returns on capital employed (ROCE) that are increasing, in conjunction with a growing amount of capital employed. Basically this means that a company has profitable initiatives that it can continue to reinvest in, which is a trait of a compounding machine. Speaking of which, we noticed some great changes in MYR Group's (NASDAQ:MYRG) returns on capital, so let's have a look.
Return On Capital Employed (ROCE): What Is It?
If you haven't worked with ROCE before, it measures the 'return' (pre-tax profit) a company generates from capital employed in its business. Analysts use this formula to calculate it for MYR Group:
Return on Capital Employed = Earnings Before Interest and Tax (EBIT) ÷ (Total Assets - Current Liabilities)
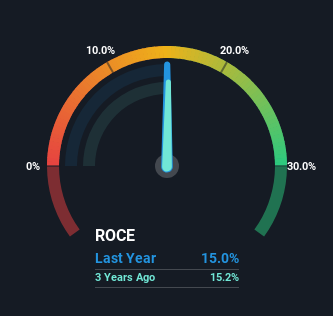
0.15 = US$125m ÷ (US$1.6b - US$747m) (Based on the trailing twelve months to December 2023).
Therefore, MYR Group has an ROCE of 15%. On its own, that's a standard return, however it's much better than the 12% generated by the Construction industry.
View our latest analysis for MYR Group
Above you can see how the current ROCE for MYR Group compares to its prior returns on capital, but there's only so much you can tell from the past. If you're interested, you can view the analysts predictions in our free analyst report for MYR Group .
How Are Returns Trending?
The trends we've noticed at MYR Group are quite reassuring. Over the last five years, returns on capital employed have risen substantially to 15%. Basically the business is earning more per dollar of capital invested and in addition to that, 79% more capital is being employed now too. So we're very much inspired by what we're seeing at MYR Group thanks to its ability to profitably reinvest capital.
On a separate but related note, it's important to know that MYR Group has a current liabilities to total assets ratio of 47%, which we'd consider pretty high. This effectively means that suppliers (or short-term creditors) are funding a large portion of the business, so just be aware that this can introduce some elements of risk. While it's not necessarily a bad thing, it can be beneficial if this ratio is lower.
The Key Takeaway
To sum it up, MYR Group has proven it can reinvest in the business and generate higher returns on that capital employed, which is terrific. And with the stock having performed exceptionally well over the last five years, these patterns are being accounted for by investors. Therefore, we think it would be worth your time to check if these trends are going to continue.
Before jumping to any conclusions though, we need to know what value we're getting for the current share price. That's where you can check out our FREE intrinsic value estimation for MYRG that compares the share price and estimated value.
If you want to search for solid companies with great earnings, check out this free list of companies with good balance sheets and impressive returns on equity.
New: Manage All Your Stock Portfolios in One Place
We've created the ultimate portfolio companion for stock investors, and it's free.
• Connect an unlimited number of Portfolios and see your total in one currency
• Be alerted to new Warning Signs or Risks via email or mobile
• Track the Fair Value of your stocks
Have feedback on this article? Concerned about the content? Get in touch with us directly. Alternatively, email editorial-team (at) simplywallst.com.
This article by Simply Wall St is general in nature. We provide commentary based on historical data and analyst forecasts only using an unbiased methodology and our articles are not intended to be financial advice. It does not constitute a recommendation to buy or sell any stock, and does not take account of your objectives, or your financial situation. We aim to bring you long-term focused analysis driven by fundamental data. Note that our analysis may not factor in the latest price-sensitive company announcements or qualitative material. Simply Wall St has no position in any stocks mentioned.
About NasdaqGS:MYRG
MYR Group
Through its subsidiaries, provides electrical construction services in the United States and Canada.
Flawless balance sheet with proven track record.
Similar Companies
Market Insights

Advertisement
Community Narratives
MicroVision will explode future revenue by 380.37% with a vision towards success
Fair Value US$60|98.4% undervalued
TH
Community Contributor
The Indispensable Artery for a New North American Economy
Fair Value CA$132.87|0.7% overvalued
TI
Community Contributor
Recently Updated Narratives
CO

composite32 on Astor Enerji ·
Astor Enerji will surge with a fair value of $140.43 in the next 3 years
Fair Value:₺140.4335.5% undervalued
1 followerusers have followed this narrative
0 commentsusers have commented on this narrative
0 likesusers have liked this narrative
RE

RecMag on Proximus ·
Proximus: The State-Backed Backup Plan with 7% Gross Yield and 15% Currency Upside.
Fair Value:€17.1356.7% undervalued
29 followersusers have followed this narrative
0 commentsusers have commented on this narrative
0 likesusers have liked this narrative
AG


Agricola on IMPACT Silver ·
A case for for IMPACT Silver Corp (TSXV:IPT) to reach USD $4.52 (CAD $6.16) in 2026 (23 bagger in 1 year) and USD $5.76 (CAD $7.89) by 2030
Fair Value:CA$7.8996.2% undervalued
1 followerusers have followed this narrative
0 commentsusers have commented on this narrative
0 likesusers have liked this narrative
Popular Narratives
TH

TheWallstreetKing on MicroVision ·
MicroVision will explode future revenue by 380.37% with a vision towards success
Fair Value:US$6098.4% undervalued
101 followersusers have followed this narrative
10 commentsusers have commented on this narrative
20 likesusers have liked this narrative
OS


oscargarcia on Alphabet ·
The company that turned a verb into a global necessity and basically runs the modern internet, digital ads, smartphones, maps, and AI.
Fair Value:US$3405.8% undervalued
137 followersusers have followed this narrative
6 commentsusers have commented on this narrative
18 likesusers have liked this narrative
AN


AnalystConsensusTarget on NVIDIA ·
NVDA: Expanding AI Demand Will Drive Major Data Center Investments Through 2026
Fair Value:US$232.7924.0% undervalued
929 followersusers have followed this narrative
6 commentsusers have commented on this narrative
22 likesusers have liked this narrative