
Advertisement
- United States
- /
- Machinery
- /
- NasdaqCM:LBGJ
Li Bang International Corporation Inc. (NASDAQ:LBGJ) Surges 29% Yet Its Low P/S Is No Reason For Excitement
Those holding Li Bang International Corporation Inc. (NASDAQ:LBGJ) shares would be relieved that the share price has rebounded 29% in the last thirty days, but it needs to keep going to repair the recent damage it has caused to investor portfolios. But the last month did very little to improve the 84% share price decline over the last year.
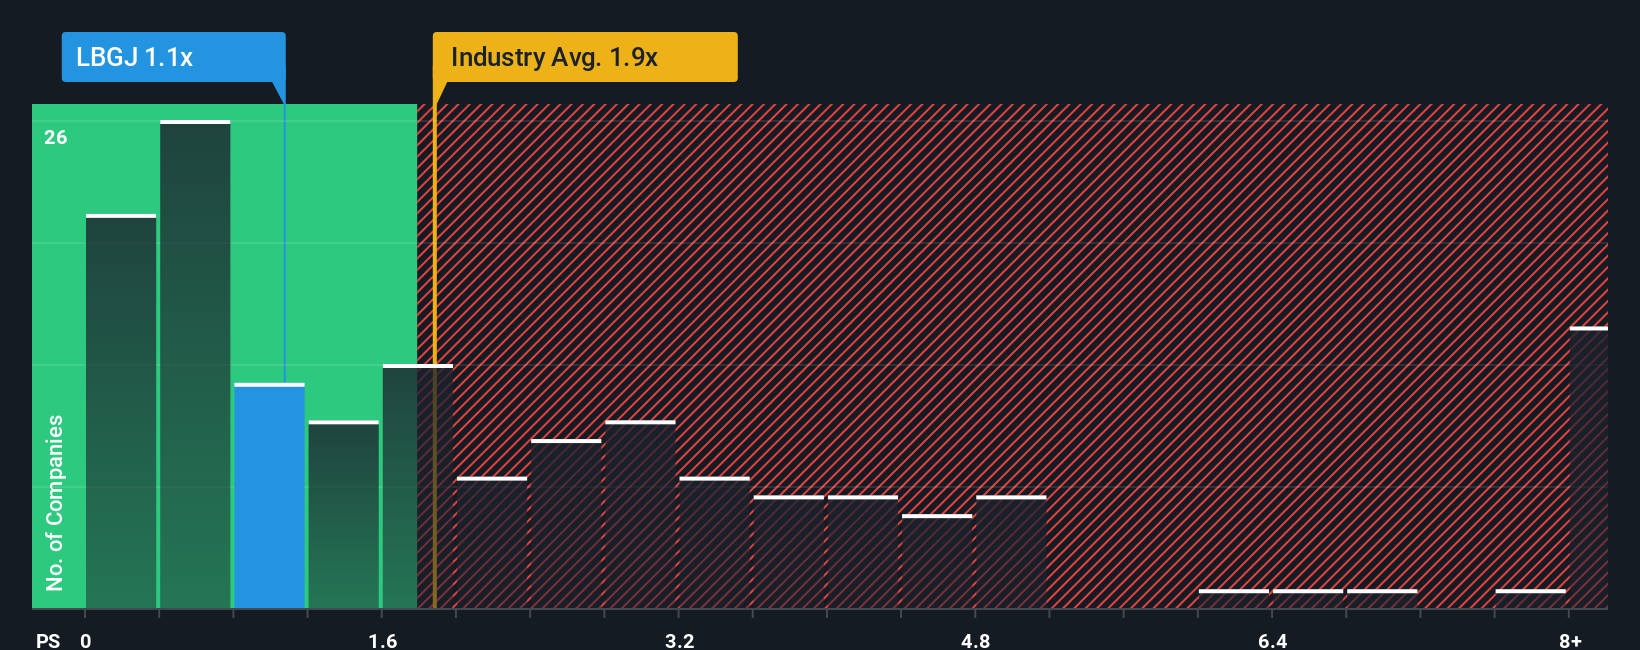
Even after such a large jump in price, Li Bang International's price-to-sales (or "P/S") ratio of 1.1x might still make it look like a buy right now compared to the Machinery industry in the United States, where around half of the companies have P/S ratios above 1.9x and even P/S above 4x are quite common. Nonetheless, we'd need to dig a little deeper to determine if there is a rational basis for the reduced P/S.
Check out our latest analysis for Li Bang International
How Li Bang International Has Been Performing
Li Bang International has been doing a good job lately as it's been growing revenue at a solid pace. Perhaps the market is expecting this acceptable revenue performance to take a dive, which has kept the P/S suppressed. If you like the company, you'd be hoping this isn't the case so that you could potentially pick up some stock while it's out of favour.
Want the full picture on earnings, revenue and cash flow for the company? Then our free report on Li Bang International will help you shine a light on its historical performance.How Is Li Bang International's Revenue Growth Trending?
Li Bang International's P/S ratio would be typical for a company that's only expected to deliver limited growth, and importantly, perform worse than the industry.
Taking a look back first, we see that the company grew revenue by an impressive 22% last year. However, this wasn't enough as the latest three year period has seen the company endure a nasty 20% drop in revenue in aggregate. Accordingly, shareholders would have felt downbeat about the medium-term rates of revenue growth.
In contrast to the company, the rest of the industry is expected to grow by 18% over the next year, which really puts the company's recent medium-term revenue decline into perspective.
With this in mind, we understand why Li Bang International's P/S is lower than most of its industry peers. However, we think shrinking revenues are unlikely to lead to a stable P/S over the longer term, which could set up shareholders for future disappointment. Even just maintaining these prices could be difficult to achieve as recent revenue trends are already weighing down the shares.
The Final Word
Despite Li Bang International's share price climbing recently, its P/S still lags most other companies. Typically, we'd caution against reading too much into price-to-sales ratios when settling on investment decisions, though it can reveal plenty about what other market participants think about the company.
As we suspected, our examination of Li Bang International revealed its shrinking revenue over the medium-term is contributing to its low P/S, given the industry is set to grow. At this stage investors feel the potential for an improvement in revenue isn't great enough to justify a higher P/S ratio. If recent medium-term revenue trends continue, it's hard to see the share price moving strongly in either direction in the near future under these circumstances.
Having said that, be aware Li Bang International is showing 4 warning signs in our investment analysis, and 3 of those don't sit too well with us.
If companies with solid past earnings growth is up your alley, you may wish to see this free collection of other companies with strong earnings growth and low P/E ratios.
New: AI Stock Screener & Alerts
Our new AI Stock Screener scans the market every day to uncover opportunities.
• Dividend Powerhouses (3%+ Yield)
• Undervalued Small Caps with Insider Buying
• High growth Tech and AI Companies
Or build your own from over 50 metrics.
Have feedback on this article? Concerned about the content? Get in touch with us directly. Alternatively, email editorial-team (at) simplywallst.com.
This article by Simply Wall St is general in nature. We provide commentary based on historical data and analyst forecasts only using an unbiased methodology and our articles are not intended to be financial advice. It does not constitute a recommendation to buy or sell any stock, and does not take account of your objectives, or your financial situation. We aim to bring you long-term focused analysis driven by fundamental data. Note that our analysis may not factor in the latest price-sensitive company announcements or qualitative material. Simply Wall St has no position in any stocks mentioned.
About NasdaqCM:LBGJ
Li Bang International
Engages in the design, development, production, and sale of stainless-steel commercial kitchen equipment under the Li Bang brand in China.
Slight risk and slightly overvalued.
Market Insights

Advertisement
Community Narratives
The company that turned a verb into a global necessity and basically runs the modern internet, digital ads, smartphones, maps, and AI.
Fair Value US$300.00|8.5% undervalued
OS
Community Contributor
Flowers Foods Pays A Fair Price For Health
Fair Value US$16.12|24.6% undervalued
NV
Community Contributor
TMX Group will thrive with 33.3% profit margin and enduring market moat
Fair Value CA$49.90|0.1% undervalued
LI
Community Contributor