
Advertisement
- United States
- /
- Trade Distributors
- /
- NasdaqCM:FGI
Returns On Capital Signal Tricky Times Ahead For FGI Industries (NASDAQ:FGI)
Did you know there are some financial metrics that can provide clues of a potential multi-bagger? In a perfect world, we'd like to see a company investing more capital into its business and ideally the returns earned from that capital are also increasing. Basically this means that a company has profitable initiatives that it can continue to reinvest in, which is a trait of a compounding machine. However, after briefly looking over the numbers, we don't think FGI Industries (NASDAQ:FGI) has the makings of a multi-bagger going forward, but let's have a look at why that may be.
Understanding Return On Capital Employed (ROCE)
Just to clarify if you're unsure, ROCE is a metric for evaluating how much pre-tax income (in percentage terms) a company earns on the capital invested in its business. Analysts use this formula to calculate it for FGI Industries:
Return on Capital Employed = Earnings Before Interest and Tax (EBIT) ÷ (Total Assets - Current Liabilities)
0.061 = US$2.3m ÷ (US$66m - US$28m) (Based on the trailing twelve months to December 2023).
Therefore, FGI Industries has an ROCE of 6.1%. In absolute terms, that's a low return and it also under-performs the Trade Distributors industry average of 13%.
See our latest analysis for FGI Industries
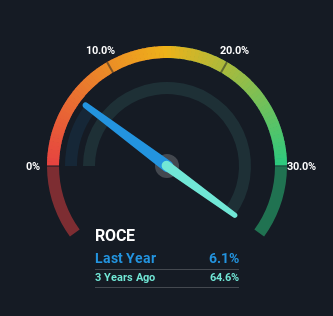
Above you can see how the current ROCE for FGI Industries compares to its prior returns on capital, but there's only so much you can tell from the past. If you're interested, you can view the analysts predictions in our free analyst report for FGI Industries .
How Are Returns Trending?
In terms of FGI Industries' historical ROCE movements, the trend isn't fantastic. Over the last four years, returns on capital have decreased to 6.1% from 23% four years ago. And considering revenue has dropped while employing more capital, we'd be cautious. This could mean that the business is losing its competitive advantage or market share, because while more money is being put into ventures, it's actually producing a lower return - "less bang for their buck" per se.
On a side note, FGI Industries has done well to pay down its current liabilities to 43% of total assets. That could partly explain why the ROCE has dropped. Effectively this means their suppliers or short-term creditors are funding less of the business, which reduces some elements of risk. Some would claim this reduces the business' efficiency at generating ROCE since it is now funding more of the operations with its own money. Keep in mind 43% is still pretty high, so those risks are still somewhat prevalent.
In Conclusion...
From the above analysis, we find it rather worrisome that returns on capital and sales for FGI Industries have fallen, meanwhile the business is employing more capital than it was four years ago. Long term shareholders who've owned the stock over the last year have experienced a 29% depreciation in their investment, so it appears the market might not like these trends either. That being the case, unless the underlying trends revert to a more positive trajectory, we'd consider looking elsewhere.
If you want to know some of the risks facing FGI Industries we've found 4 warning signs (1 is a bit unpleasant!) that you should be aware of before investing here.
If you want to search for solid companies with great earnings, check out this free list of companies with good balance sheets and impressive returns on equity.
New: AI Stock Screener & Alerts
Our new AI Stock Screener scans the market every day to uncover opportunities.
• Dividend Powerhouses (3%+ Yield)
• Undervalued Small Caps with Insider Buying
• High growth Tech and AI Companies
Or build your own from over 50 metrics.
Have feedback on this article? Concerned about the content? Get in touch with us directly. Alternatively, email editorial-team (at) simplywallst.com.
This article by Simply Wall St is general in nature. We provide commentary based on historical data and analyst forecasts only using an unbiased methodology and our articles are not intended to be financial advice. It does not constitute a recommendation to buy or sell any stock, and does not take account of your objectives, or your financial situation. We aim to bring you long-term focused analysis driven by fundamental data. Note that our analysis may not factor in the latest price-sensitive company announcements or qualitative material. Simply Wall St has no position in any stocks mentioned.
About NasdaqCM:FGI
FGI Industries
FGI Industries ltd. supplies bath and kitchen products retail, wholesale, commercial and specialty channel customers in the United States, Canada, Europe, and internationally.
Undervalued with slight risk.
Similar Companies
Market Insights

Advertisement
Community Narratives
MINISO's fair value is projected at 26.69 with an anticipated PE ratio shift of 20x
Fair Value US$24.03|11.0% undervalued
BE
Community Contributor
Procter & Gamble: A Dividend Giant Facing Slowing Growth
Fair Value US$119.81|23.3% overvalued
AN
Community Contributor
Eli Lilly's Future Growth Driven by Tirzepatide and Favorable Market Conditions
Fair Value US$1.19k|13.8% undervalued
EA
Community Contributor