Advertisement
- United States
- /
- Banks
- /
- NYSE:CBNA
Chain Bridge Bancorp (CBNA): Revenue Growth Beats Market, Challenges Narrative as Margins Narrow

Simply Wall St
Reviewed by Simply Wall St
Chain Bridge Bancorp (CBNA) is forecasting revenue growth of 20.8% per year, outpacing the broader US market’s 10.2% rate. However, earnings are expected to rise at just 12.3% annually, which lags behind the overall market’s 15.6% pace. Net profit margins have slipped, coming in at 35.1% compared to 41.1% a year ago. The company’s favorably low Price-to-Earnings Ratio of 10.4x and a share price of $29.52, well under the estimated fair value of $114.34, suggest an attractive valuation setup for investors.
See our full analysis for Chain Bridge Bancorp.Next, we will see how these headline numbers stack up against the consensus and community narratives. Some expectations may be confirmed while others could get upended.
Curious how numbers become stories that shape markets? Explore Community Narratives
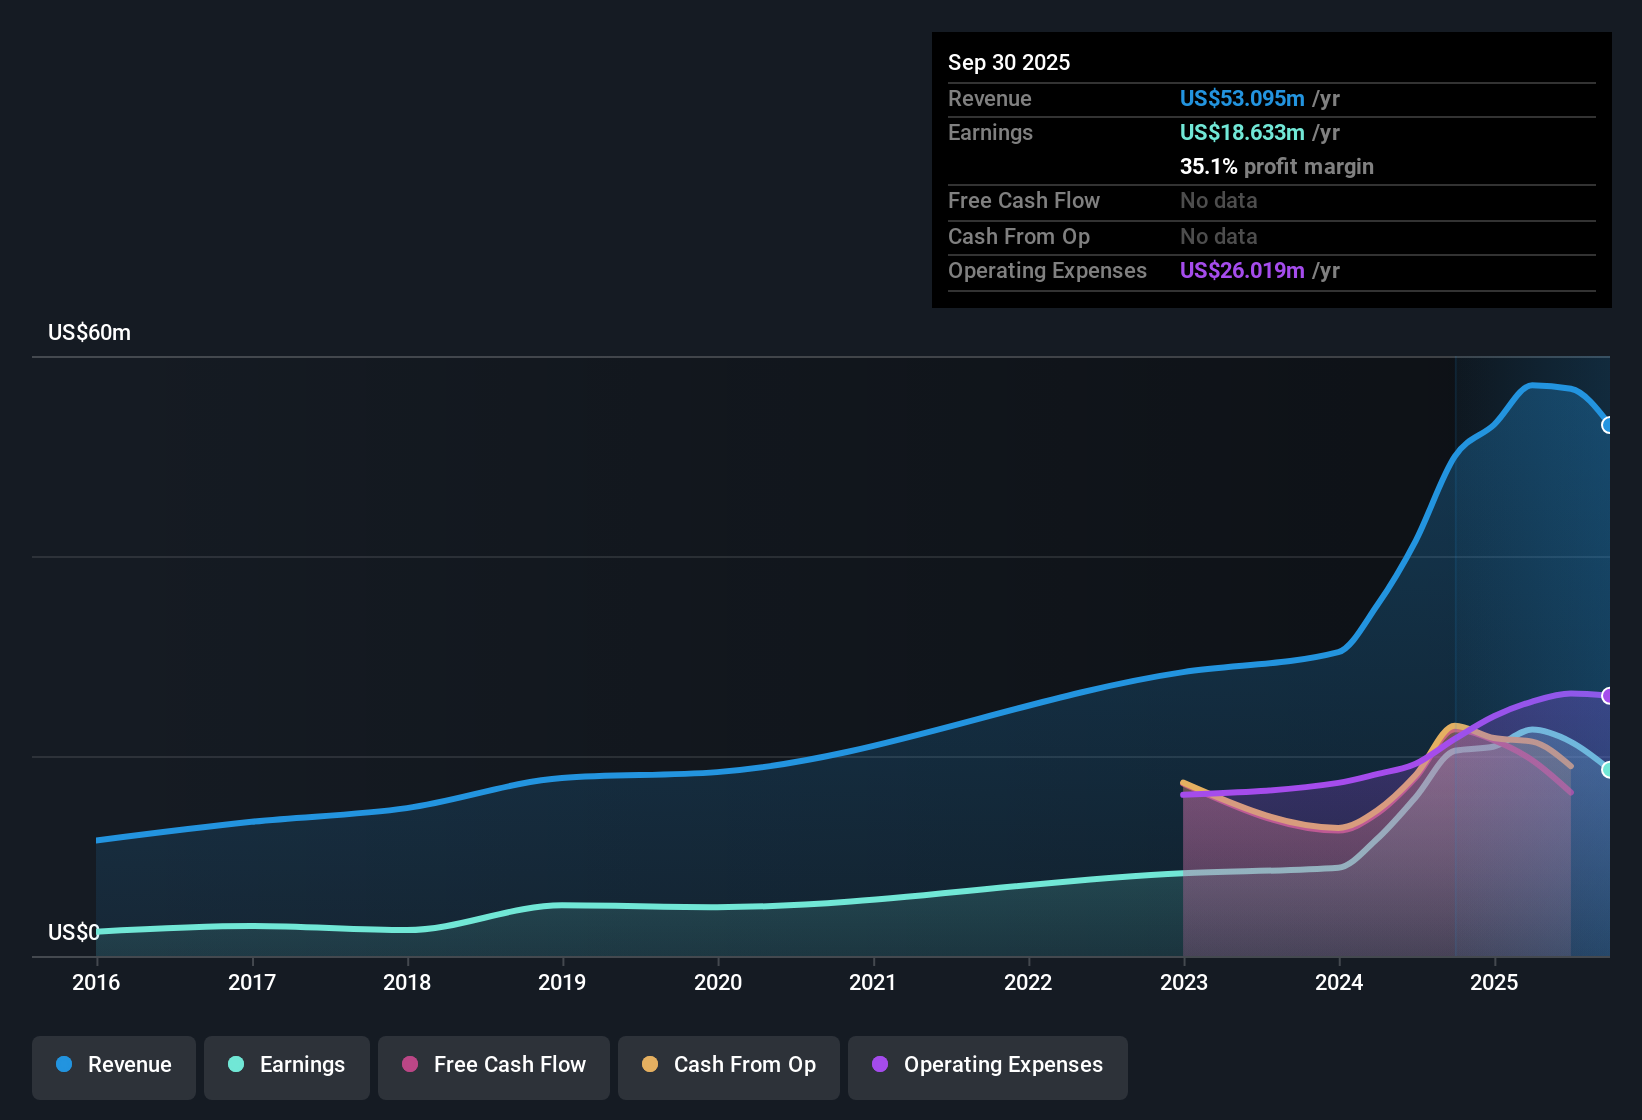
Net Margins Narrow But Remain High
- Profit margins decreased to 35.1% from 41.1% last year, remaining well above the average for regional banks even after the drop.
- Bulls often highlight CBNA’s capacity to hold elevated margins as proof of fundamental strength. What’s surprising is that margin compression coincides with earnings growth trailing the market average.
- This tension challenges the claim that superior profitability will automatically drive outsized earnings gains, since earnings are now forecast to increase just 12.3% per year, behind the market’s 15.6% pace.
- It also complicates the bullish view that CBNA’s operating quality sets it apart from peers, as both top-line growth and margin retention must continue for the advantage to persist.
Valuation Gap: P/E and DCF Signal Room to Run
- The current share price of $29.52 trades at a Price-to-Earnings Ratio of 10.4x, lower than both the peer average (14.2x) and industry average (11.2x), and sits far beneath the DCF fair value estimate of $114.34.
- The prevailing market view points to an unusually wide value gap, with several factors reinforcing a “cheap on paper” thesis. However, modest earnings growth and recent margin pressure raise questions about whether the discount is fully deserved.
- The steep DCF discount suggests the market might be overly cautious, but this will only close if management can deliver on the growth implied by such a valuation.
- Investors watching for a turnaround need to see not just low multiples but also a return to stronger margin or earnings performance to justify a rerating.
Revenue Outlook Stays Above Industry Trend
- Revenue is forecast to climb 20.8% per year, doubling the broader US market’s 10.2% growth expectation and supporting the narrative of a local outlier.
- The prevailing market view sees this revenue acceleration as a stabilizing force for sentiment. However, muted profit expansion and the absence of highlighted risks temper enthusiasm about upside beyond the current strong growth forecast.
- Strong revenue growth helps sustain positive investor perception even as profits lag, showing that top-line momentum remains a source of optimism.
- Without explicit risk warnings, the focus is now on whether operational execution can turn above-market sales growth into long-term earnings leverage.
Next Steps
Don't just look at this quarter; the real story is in the long-term trend. We've done an in-depth analysis on Chain Bridge Bancorp's growth and its valuation to see if today's price is a bargain. Add the company to your watchlist or portfolio now so you don't miss the next big move.
See What Else Is Out There
While revenue growth is impressive, Chain Bridge Bancorp’s shrinking margins and below-market earnings forecasts signal inconsistency in translating sales momentum into sustained profit gains.
If steady results matter to you, use stable growth stocks screener (2122 results) to focus on companies delivering reliable revenue and earnings growth through every part of the market cycle.
This article by Simply Wall St is general in nature. We provide commentary based on historical data and analyst forecasts only using an unbiased methodology and our articles are not intended to be financial advice. It does not constitute a recommendation to buy or sell any stock, and does not take account of your objectives, or your financial situation. We aim to bring you long-term focused analysis driven by fundamental data. Note that our analysis may not factor in the latest price-sensitive company announcements or qualitative material. Simply Wall St has no position in any stocks mentioned.
New: AI Stock Screener & Alerts
Our new AI Stock Screener scans the market every day to uncover opportunities.
• Dividend Powerhouses (3%+ Yield)
• Undervalued Small Caps with Insider Buying
• High growth Tech and AI Companies
Or build your own from over 50 metrics.
Have feedback on this article? Concerned about the content? Get in touch with us directly. Alternatively, email editorial-team@simplywallst.com
About NYSE:CBNA
Chain Bridge Bancorp
Operates as a bank holding company for Chain Bridge Bank, N.A.
Undervalued with adequate balance sheet.
Market Insights

Advertisement
Community Narratives
The company that turned a verb into a global necessity and basically runs the modern internet, digital ads, smartphones, maps, and AI.
Fair Value US$300.00|8.5% undervalued
OS
Community Contributor
Flowers Foods Pays A Fair Price For Health
Fair Value US$16.12|24.6% undervalued
NV
Community Contributor
TMX Group will thrive with 33.3% profit margin and enduring market moat
Fair Value CA$49.90|0.1% undervalued
LI
Community Contributor