Advertisement
- United States
- /
- Banks
- /
- NYSE:C
Is Citigroup’s Three Year 150% Surge Backed by Real Value in 2025?

Simply Wall St
Reviewed by Bailey Pemberton
- Thinking Citigroup might be a bargain or maybe getting ahead of itself? Let’s unpack what’s really driving its value story.
- After a strong run, Citigroup shares are up 2.6% this week, 45.4% year-to-date, and have soared 150.0% over three years, hinting at shifting market sentiment and emerging optimism.
- Investors have taken note following several strategic moves by the company, such as streamlining its global operations and ongoing cost-cutting initiatives. Recent headlines about corporate restructuring and divestitures have added momentum, making it a frequent subject of analyst conversations.
- Our initial valuation check gives Citigroup a score of 3 out of 6 for undervaluation. There’s plenty to discuss, starting with popular valuation yardsticks and wrapping up with a smarter way to connect the dots in the final analysis.
Approach 1: Citigroup Excess Returns Analysis
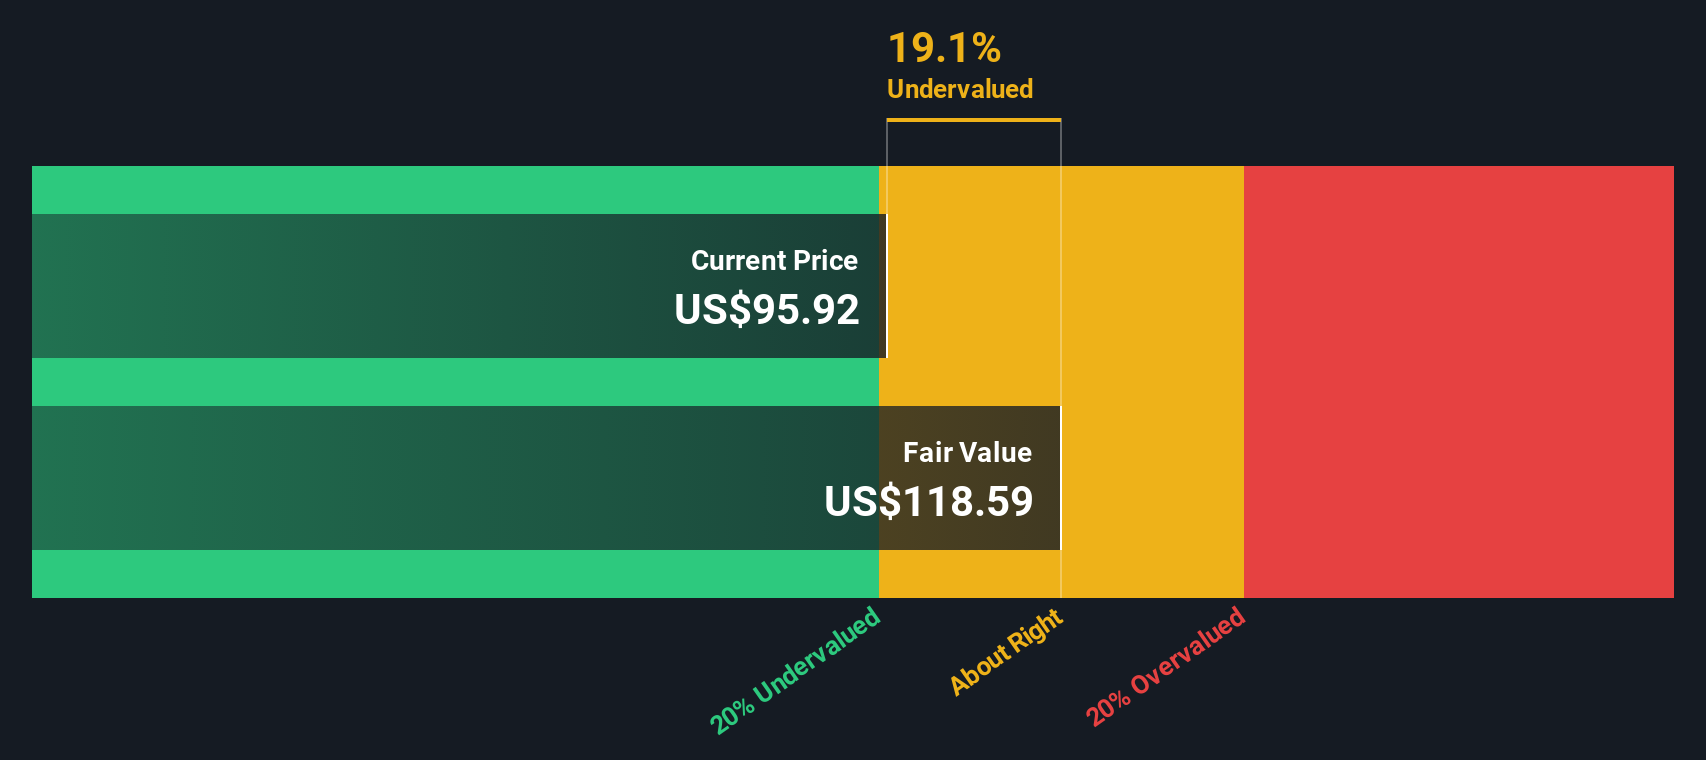
The Excess Returns Model evaluates how much value a company creates by comparing its return on invested capital to its cost of equity. This approach focuses on how profitably Citigroup reinvests earnings over time.
For Citigroup, the data shows a book value of $108.41 per share and an average return on equity of 8.66%. The model projects a stable EPS of $10.29 per share, based on estimates from 14 analysts, while the cost of equity is $9.56 per share. This generates an excess return of $0.73 per share, suggesting that Citigroup is producing returns above its cost of capital, which is an indicator of healthy capital allocation. In addition, the stable book value is expected to reach $118.91 per share according to analyst forecasts from 11 experts.
Based on these metrics, the intrinsic value calculated by the Excess Returns Model is roughly 24.0% higher than the recent market price. This suggests Citigroup stock is undervalued and could represent an opportunity for investors looking for long-term value creation, as its profitability metrics remain robust.
Result: UNDERVALUED
Our Excess Returns analysis suggests Citigroup is undervalued by 24.0%. Track this in your watchlist or portfolio, or discover 838 more undervalued stocks based on cash flows.
Approach 2: Citigroup Price vs Earnings
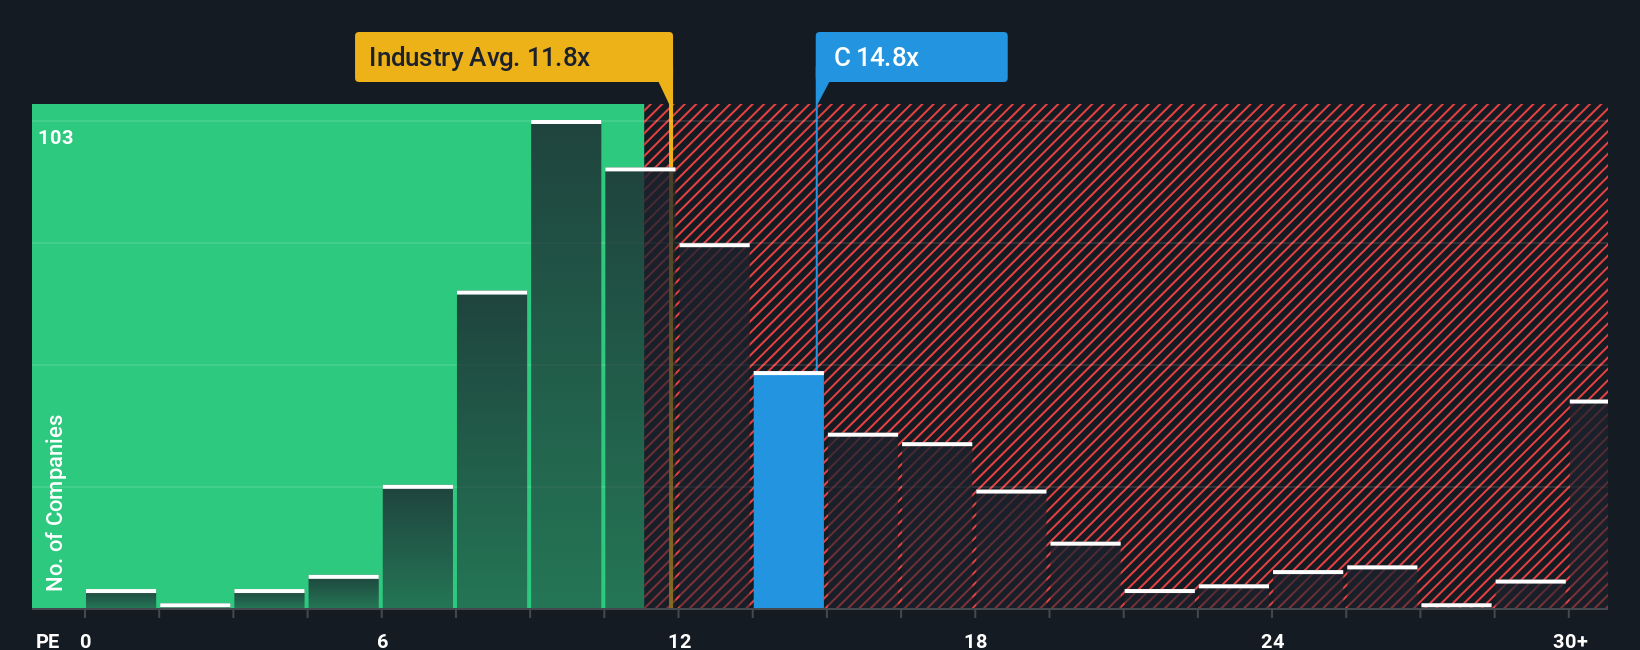
The Price-to-Earnings (PE) ratio is one of the most popular tools for valuing profitable companies like Citigroup because it captures how much investors are willing to pay for each dollar of reported earnings. PE ratios are especially useful when a company has a steady record of profitability, allowing for meaningful comparisons both to peers and to its own historical valuation.
Growth expectations and risk play a key role in what constitutes a “normal” or “fair” PE ratio. High growth outlooks or lower perceived risks typically warrant higher PE multiples, while stagnant earnings or sector headwinds suppress them. Citigroup is currently trading at a PE ratio of 13.54x, which is above the Banks industry average of 11.08x and the peer average of 12.41x. On the surface, this might suggest its shares are slightly more expensive than its sector counterparts.
However, the "Fair Ratio" developed by Simply Wall St takes a broader view. Unlike simple peer or industry comparison, this proprietary metric weighs factors such as Citigroup’s earnings growth, profit margins, market cap, and risk profile, all within the industry context. For Citigroup, the Fair Ratio is calculated at 16.37x. This figure sets a more customized benchmark, indicating that, after all variables are considered, Citigroup’s current multiple actually sits below what would be expected for a company of its profile. This points to potential undervaluation.
Result: UNDERVALUED
PE ratios tell one story, but what if the real opportunity lies elsewhere? Discover 1403 companies where insiders are betting big on explosive growth.
Upgrade Your Decision Making: Choose your Citigroup Narrative
Earlier we mentioned that there's an even better way to understand valuation, so let's introduce you to Narratives, a simple, dynamic approach that helps investors connect a company’s real story with the numbers behind its future value.
A Narrative allows you to express your perspective on Citigroup by building a story about where you think the business is headed, linking your views on growth, profitability, and risks directly to a financial forecast and a resulting fair value.
On Simply Wall St's Community page, millions of investors already use Narratives as an easy tool to shape their own investment case for Citigroup, updating their fair value in real time as news or earnings emerge.
By comparing each Narrative's fair value to the current share price, you can clearly see what assumptions you or others are making and decide when to buy or sell, with the added benefit that forecasts adjust automatically as new information arrives.
For example, one investor might set a high fair value for Citigroup based on strong growth in digital assets and a robust buyback plan, while another could take a more cautious view with a lower valuation focused on regulatory and restructuring risks. This approach allows you to see, at a glance, how different stories drive different price targets.
Do you think there's more to the story for Citigroup? Head over to our Community to see what others are saying!
This article by Simply Wall St is general in nature. We provide commentary based on historical data and analyst forecasts only using an unbiased methodology and our articles are not intended to be financial advice. It does not constitute a recommendation to buy or sell any stock, and does not take account of your objectives, or your financial situation. We aim to bring you long-term focused analysis driven by fundamental data. Note that our analysis may not factor in the latest price-sensitive company announcements or qualitative material. Simply Wall St has no position in any stocks mentioned.
New: AI Stock Screener & Alerts
Our new AI Stock Screener scans the market every day to uncover opportunities.
• Dividend Powerhouses (3%+ Yield)
• Undervalued Small Caps with Insider Buying
• High growth Tech and AI Companies
Or build your own from over 50 metrics.
Have feedback on this article? Concerned about the content? Get in touch with us directly. Alternatively, email editorial-team@simplywallst.com
About NYSE:C
Citigroup
A diversified financial service holding company, provides various financial product and services to consumers, corporations, governments, and institutions.
Flawless balance sheet established dividend payer.
Similar Companies
Market Insights

Advertisement
Community Narratives
The company that turned a verb into a global necessity and basically runs the modern internet, digital ads, smartphones, maps, and AI.
Fair Value US$300.00|5.2% undervalued
OS
Community Contributor
Flowers Foods Pays A Fair Price For Health
Fair Value US$16.12|24.9% undervalued
NV
Community Contributor
TMX Group will thrive with 33.3% profit margin and enduring market moat
Fair Value CA$49.90|3.3% overvalued
LI
Community Contributor
The "Molecular Pencil": Why Beam's Technology is Built to Win
Fair Value US$65.01|64.5% undervalued
DA
Community Contributor