- United States
- /
- Banks
- /
- NYSE:C
Despite the downward trend in earnings at Citigroup (NYSE:C) the stock advances 7.8%, bringing one-year gains to 58%


Passive investing in index funds can generate returns that roughly match the overall market. But if you pick the right individual stocks, you could make more than that. To wit, the Citigroup Inc. (NYSE:C) share price is 52% higher than it was a year ago, much better than the market return of around 31% (not including dividends) in the same period. That's a solid performance by our standards! Unfortunately the longer term returns are not so good, with the stock falling 13% in the last three years.
On the back of a solid 7-day performance, let's check what role the company's fundamentals have played in driving long term shareholder returns.
See our latest analysis for Citigroup
There is no denying that markets are sometimes efficient, but prices do not always reflect underlying business performance. By comparing earnings per share (EPS) and share price changes over time, we can get a feel for how investor attitudes to a company have morphed over time.
Over the last twelve months, Citigroup actually shrank its EPS by 43%.
This means it's unlikely the market is judging the company based on earnings growth. Indeed, when EPS is declining but the share price is up, it often means the market is considering other factors.
Revenue was pretty stable on last year, so deeper research might be needed to explain the share price rise.
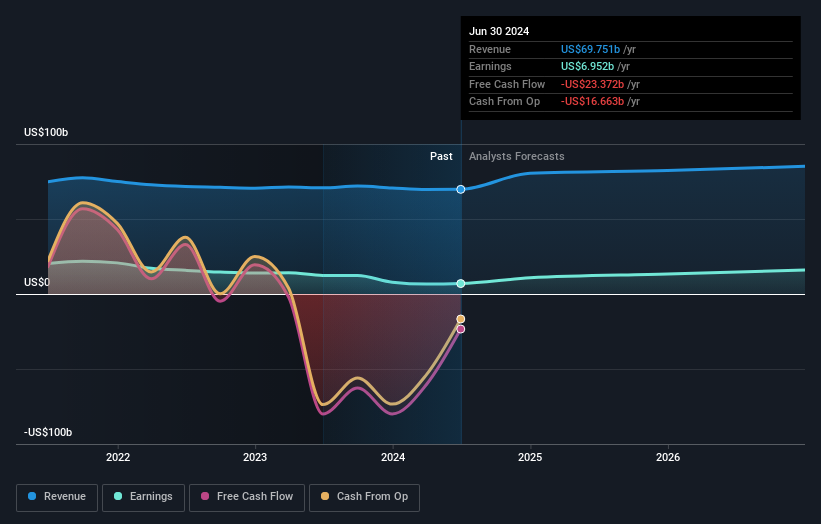
The company's revenue and earnings (over time) are depicted in the image below (click to see the exact numbers).
Citigroup is a well known stock, with plenty of analyst coverage, suggesting some visibility into future growth. If you are thinking of buying or selling Citigroup stock, you should check out this free report showing analyst consensus estimates for future profits.
What About Dividends?
It is important to consider the total shareholder return, as well as the share price return, for any given stock. Whereas the share price return only reflects the change in the share price, the TSR includes the value of dividends (assuming they were reinvested) and the benefit of any discounted capital raising or spin-off. It's fair to say that the TSR gives a more complete picture for stocks that pay a dividend. In the case of Citigroup, it has a TSR of 58% for the last 1 year. That exceeds its share price return that we previously mentioned. This is largely a result of its dividend payments!
A Different Perspective
We're pleased to report that Citigroup shareholders have received a total shareholder return of 58% over one year. That's including the dividend. That's better than the annualised return of 1.6% over half a decade, implying that the company is doing better recently. Given the share price momentum remains strong, it might be worth taking a closer look at the stock, lest you miss an opportunity. While it is well worth considering the different impacts that market conditions can have on the share price, there are other factors that are even more important. To that end, you should be aware of the 2 warning signs we've spotted with Citigroup .
We will like Citigroup better if we see some big insider buys. While we wait, check out this free list of undervalued stocks (mostly small caps) with considerable, recent, insider buying.
Please note, the market returns quoted in this article reflect the market weighted average returns of stocks that currently trade on American exchanges.
New: AI Stock Screener & Alerts
Our new AI Stock Screener scans the market every day to uncover opportunities.
• Dividend Powerhouses (3%+ Yield)
• Undervalued Small Caps with Insider Buying
• High growth Tech and AI Companies
Or build your own from over 50 metrics.
Have feedback on this article? Concerned about the content? Get in touch with us directly. Alternatively, email editorial-team (at) simplywallst.com.
This article by Simply Wall St is general in nature. We provide commentary based on historical data and analyst forecasts only using an unbiased methodology and our articles are not intended to be financial advice. It does not constitute a recommendation to buy or sell any stock, and does not take account of your objectives, or your financial situation. We aim to bring you long-term focused analysis driven by fundamental data. Note that our analysis may not factor in the latest price-sensitive company announcements or qualitative material. Simply Wall St has no position in any stocks mentioned.
About NYSE:C
Citigroup
A diversified financial service holding company, provides various financial product and services to consumers, corporations, governments, and institutions worldwide.
Flawless balance sheet established dividend payer.

