- United States
- /
- Banks
- /
- NasdaqCM:SBFG
SB Financial Group (NASDAQ:SBFG) Has Affirmed Its Dividend Of $0.12
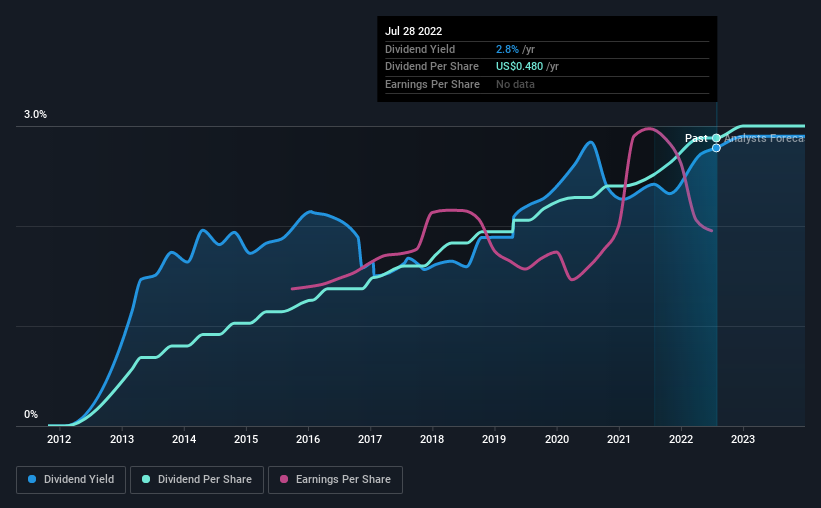
The board of SB Financial Group, Inc. (NASDAQ:SBFG) has announced that it will pay a dividend on the 26th of August, with investors receiving $0.12 per share. This payment means that the dividend yield will be 2.8%, which is around the industry average.
See our latest analysis for SB Financial Group
SB Financial Group's Dividend Forecasted To Be Well Covered By Earnings
While it is always good to see a solid dividend yield, we should also consider whether the payment is feasible.
Having paid out dividends for 9 years, SB Financial Group has a good history of paying out a part of its earnings to shareholders. Using data from its latest earnings report, SB Financial Group's payout ratio sits at 25%, an extremely comfortable number that shows that it can pay its dividend.
EPS is set to fall by 5.9% over the next 12 months. But assuming the dividend continues along recent trends, we believe the future payout ratio could be 30%, which we are pretty comfortable with and we think would be feasible on an earnings basis.

SB Financial Group Doesn't Have A Long Payment History
It is great to see that SB Financial Group has been paying a stable dividend for a number of years now, however we want to be a bit cautious about whether this will remain true through a full economic cycle. The dividend has gone from an annual total of $0.0952 in 2013 to the most recent total annual payment of $0.48. This works out to be a compound annual growth rate (CAGR) of approximately 20% a year over that time. SB Financial Group has been growing its dividend quite rapidly, which is exciting. However, the short payment history makes us question whether this performance will persist across a full market cycle.
The Dividend's Growth Prospects Are Limited
Investors could be attracted to the stock based on the quality of its payment history. However, SB Financial Group has only grown its earnings per share at 2.9% per annum over the past five years. While growth may be thin on the ground, SB Financial Group could always pay out a higher proportion of earnings to increase shareholder returns.
In Summary
Overall, we think SB Financial Group is a solid choice as a dividend stock, even though the dividend wasn't raised this year. The payout ratio looks good, but unfortunately the company's dividend track record isn't stellar. Taking all of this into consideration, the dividend looks viable moving forward, but investors should be mindful that the company has pushed the boundaries of sustainability in the past and may do so again.
Market movements attest to how highly valued a consistent dividend policy is compared to one which is more unpredictable. However, there are other things to consider for investors when analysing stock performance. Just as an example, we've come across 3 warning signs for SB Financial Group you should be aware of, and 1 of them can't be ignored. If you are a dividend investor, you might also want to look at our curated list of high yield dividend stocks.
New: Manage All Your Stock Portfolios in One Place
We've created the ultimate portfolio companion for stock investors, and it's free.
• Connect an unlimited number of Portfolios and see your total in one currency
• Be alerted to new Warning Signs or Risks via email or mobile
• Track the Fair Value of your stocks
Have feedback on this article? Concerned about the content? Get in touch with us directly. Alternatively, email editorial-team (at) simplywallst.com.
This article by Simply Wall St is general in nature. We provide commentary based on historical data and analyst forecasts only using an unbiased methodology and our articles are not intended to be financial advice. It does not constitute a recommendation to buy or sell any stock, and does not take account of your objectives, or your financial situation. We aim to bring you long-term focused analysis driven by fundamental data. Note that our analysis may not factor in the latest price-sensitive company announcements or qualitative material. Simply Wall St has no position in any stocks mentioned.
About NasdaqCM:SBFG
SB Financial Group
Operates as the financial holding company for the State Bank and Trust Company that provides a range of commercial banking and wealth management services to individual and corporate customers primarily in Ohio, Indiana, and Michigan.
Flawless balance sheet, good value and pays a dividend.
Similar Companies
Market Insights
Community Narratives


