
Advertisement
Is Mackinac Financial Corporation's (NASDAQ:MFNC) High P/E Ratio A Problem For Investors?

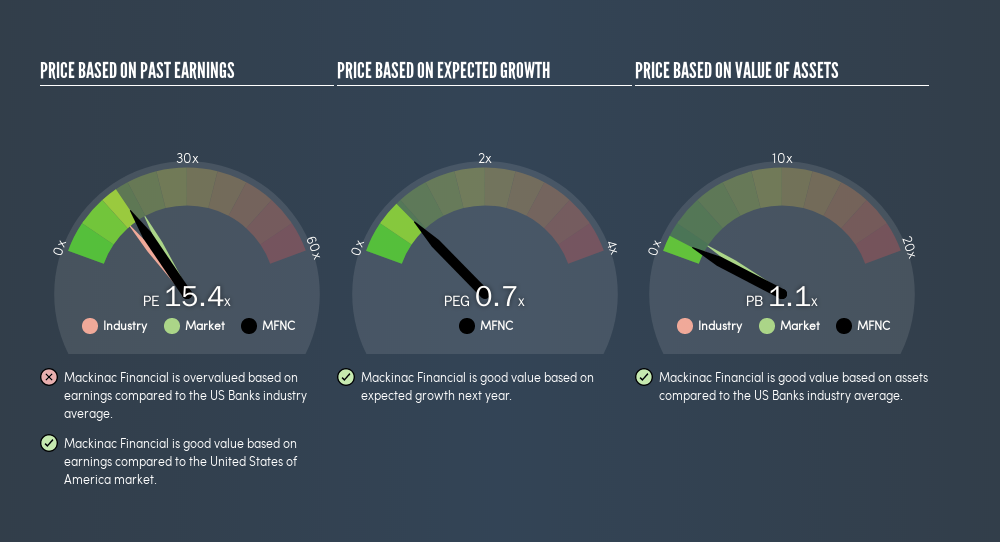
The goal of this article is to teach you how to use price to earnings ratios (P/E ratios). We'll show how you can use Mackinac Financial Corporation's (NASDAQ:MFNC) P/E ratio to inform your assessment of the investment opportunity. Looking at earnings over the last twelve months, Mackinac Financial has a P/E ratio of 15.37. That corresponds to an earnings yield of approximately 6.5%.
Want to participate in a short research study? Help shape the future of investing tools and you could win a $250 gift card!
See our latest analysis for Mackinac Financial
How Do You Calculate A P/E Ratio?
The formula for price to earnings is:
Price to Earnings Ratio = Price per Share ÷ Earnings per Share (EPS)
Or for Mackinac Financial:
P/E of 15.37 = $15.37 ÷ $1 (Based on the year to March 2019.)
Is A High P/E Ratio Good?
A higher P/E ratio means that investors are paying a higher price for each $1 of company earnings. That isn't necessarily good or bad, but a high P/E implies relatively high expectations of what a company can achieve in the future.
How Growth Rates Impact P/E Ratios
Generally speaking the rate of earnings growth has a profound impact on a company's P/E multiple. Earnings growth means that in the future the 'E' will be higher. That means even if the current P/E is high, it will reduce over time if the share price stays flat. And as that P/E ratio drops, the company will look cheap, unless its share price increases.
Most would be impressed by Mackinac Financial earnings growth of 19% in the last year. And earnings per share have improved by 5.2% annually, over the last three years. So one might expect an above average P/E ratio.
How Does Mackinac Financial's P/E Ratio Compare To Its Peers?
The P/E ratio indicates whether the market has higher or lower expectations of a company. As you can see below, Mackinac Financial has a higher P/E than the average company (12.7) in the banks industry.
That means that the market expects Mackinac Financial will outperform other companies in its industry. Clearly the market expects growth, but it isn't guaranteed. So investors should delve deeper. I like to check if company insiders have been buying or selling.
Remember: P/E Ratios Don't Consider The Balance Sheet
The 'Price' in P/E reflects the market capitalization of the company. So it won't reflect the advantage of cash, or disadvantage of debt. Theoretically, a business can improve its earnings (and produce a lower P/E in the future) by investing in growth. That means taking on debt (or spending its cash).
While growth expenditure doesn't always pay off, the point is that it is a good option to have; but one that the P/E ratio ignores.
So What Does Mackinac Financial's Balance Sheet Tell Us?
Mackinac Financial has net cash of US$16m. That should lead to a higher P/E than if it did have debt, because its strong balance sheets gives it more options.
The Bottom Line On Mackinac Financial's P/E Ratio
Mackinac Financial trades on a P/E ratio of 15.4, which is below the US market average of 17.4. Not only should the net cash position reduce risk, but the recent growth has been impressive. One might conclude that the market is a bit pessimistic, given the low P/E ratio. Given analysts are expecting further growth, one I would have expected a higher P/E ratio. So this stock may well be worth further research.
Investors should be looking to buy stocks that the market is wrong about. If it is underestimating a company, investors can make money by buying and holding the shares until the market corrects itself. So this free report on the analyst consensus forecasts could help you make a master move on this stock.
But note: Mackinac Financial may not be the best stock to buy. So take a peek at this free list of interesting companies with strong recent earnings growth (and a P/E ratio below 20).
We aim to bring you long-term focused research analysis driven by fundamental data. Note that our analysis may not factor in the latest price-sensitive company announcements or qualitative material.
If you spot an error that warrants correction, please contact the editor at editorial-team@simplywallst.com. This article by Simply Wall St is general in nature. It does not constitute a recommendation to buy or sell any stock, and does not take account of your objectives, or your financial situation. Simply Wall St has no position in the stocks mentioned. Thank you for reading.
Market Insights


Advertisement
Community Narratives
The Future of Drug Testing? Fingerprint Tech Shows Serious Promise
Fair Value US$2.98|38.6% undervalued
JO
Community Contributor
Suncorp’s Next Chapter: Insurance-Only and Ready to Grow
Fair Value AU$22.83|8.8% undervalued
RO
Community Contributor
Thyssenkrupp Nucera Will Achieve Double-Digit Profits by 2030 Boosted by Hydrogen Growth
Fair Value €14.40|31.6% undervalued
CH
Community Contributor
Tesla’s Nvidia Moment – The AI & Robotics Inflection Point
Fair Value US$384.84|18.0% undervalued
BL
Community Contributor