
Advertisement
How Does Dime Community Bancshares's (NASDAQ:DCOM) P/E Compare To Its Industry, After The Share Price Drop?

To the annoyance of some shareholders, Dime Community Bancshares (NASDAQ:DCOM) shares are down a considerable 33% in the last month. Indeed the recent decline has arguably caused some bitterness for shareholders who have held through the 34% drop over twelve months.
Assuming nothing else has changed, a lower share price makes a stock more attractive to potential buyers. While the market sentiment towards a stock is very changeable, in the long run, the share price will tend to move in the same direction as earnings per share. The implication here is that long term investors have an opportunity when expectations of a company are too low. Perhaps the simplest way to get a read on investors' expectations of a business is to look at its Price to Earnings Ratio (PE Ratio). Investors have optimistic expectations of companies with higher P/E ratios, compared to companies with lower P/E ratios.
Check out our latest analysis for Dime Community Bancshares
Does Dime Community Bancshares Have A Relatively High Or Low P/E For Its Industry?
Dime Community Bancshares's P/E of 13.11 indicates some degree of optimism towards the stock. The image below shows that Dime Community Bancshares has a higher P/E than the average (9.7) P/E for companies in the banks industry.
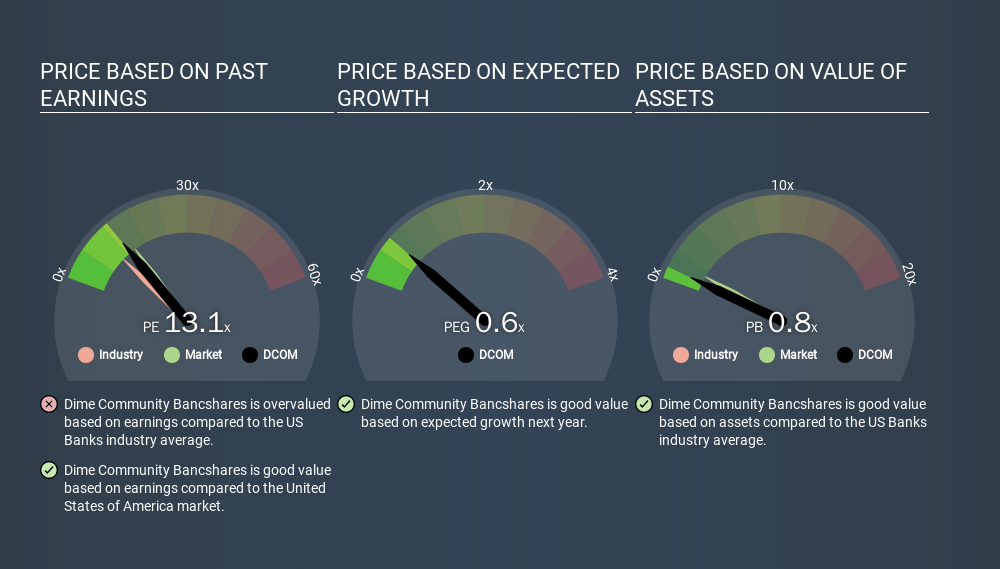
That means that the market expects Dime Community Bancshares will outperform other companies in its industry. The market is optimistic about the future, but that doesn't guarantee future growth. So investors should always consider the P/E ratio alongside other factors, such as whether company directors have been buying shares.
How Growth Rates Impact P/E Ratios
When earnings fall, the 'E' decreases, over time. That means even if the current P/E is low, it will increase over time if the share price stays flat. So while a stock may look cheap based on past earnings, it could be expensive based on future earnings.
Dime Community Bancshares shrunk earnings per share by 27% over the last year. And over the longer term (5 years) earnings per share have decreased 3.8% annually. This might lead to muted expectations.
Don't Forget: The P/E Does Not Account For Debt or Bank Deposits
The 'Price' in P/E reflects the market capitalization of the company. That means it doesn't take debt or cash into account. Hypothetically, a company could reduce its future P/E ratio by spending its cash (or taking on debt) to achieve higher earnings.
Such expenditure might be good or bad, in the long term, but the point here is that the balance sheet is not reflected by this ratio.
So What Does Dime Community Bancshares's Balance Sheet Tell Us?
Dime Community Bancshares has net debt worth a very significant 249% of its market capitalization. If you want to compare its P/E ratio to other companies, you must keep in mind that these debt levels would usually warrant a relatively low P/E.
The Bottom Line On Dime Community Bancshares's P/E Ratio
Dime Community Bancshares trades on a P/E ratio of 13.1, which is fairly close to the US market average of 13.3. With significant debt and no EPS growth last year, the P/E suggests shareholders are expecting higher profit in the future. What can be absolutely certain is that the market has become significantly less optimistic about Dime Community Bancshares over the last month, with the P/E ratio falling from 19.5 back then to 13.1 today. For those who prefer to invest with the flow of momentum, that might be a bad sign, but for a contrarian, it may signal opportunity.
Investors have an opportunity when market expectations about a stock are wrong. If the reality for a company is not as bad as the P/E ratio indicates, then the share price should increase as the market realizes this. So this free visual report on analyst forecasts could hold the key to an excellent investment decision.
Of course you might be able to find a better stock than Dime Community Bancshares. So you may wish to see this free collection of other companies that have grown earnings strongly.
If you spot an error that warrants correction, please contact the editor at editorial-team@simplywallst.com. This article by Simply Wall St is general in nature. It does not constitute a recommendation to buy or sell any stock, and does not take account of your objectives, or your financial situation. Simply Wall St has no position in the stocks mentioned.
We aim to bring you long-term focused research analysis driven by fundamental data. Note that our analysis may not factor in the latest price-sensitive company announcements or qualitative material. Thank you for reading.
Market Insights


Advertisement
Community Narratives
For the Emperor: Why Games Workshop Could Be a Star Investment
Fair Value UK£160.00|0.4% overvalued
RO
Community Contributor
Securitas will boost margins with AI and tech-driven services
Fair Value SEK 260.91|44.5% undervalued
UN
Community Contributor
A Leader in EV Charging with Growth Potential
Fair Value €27.00|17.8% undervalued
TI
Community Contributor