
Advertisement
- United States
- /
- Auto
- /
- NYSE:WGO
We Think Winnebago Industries (NYSE:WGO) Is Taking Some Risk With Its Debt
Warren Buffett famously said, 'Volatility is far from synonymous with risk.' So it seems the smart money knows that debt - which is usually involved in bankruptcies - is a very important factor, when you assess how risky a company is. We note that Winnebago Industries, Inc. (NYSE:WGO) does have debt on its balance sheet. But is this debt a concern to shareholders?
Why Does Debt Bring Risk?
Debt assists a business until the business has trouble paying it off, either with new capital or with free cash flow. If things get really bad, the lenders can take control of the business. However, a more frequent (but still costly) occurrence is where a company must issue shares at bargain-basement prices, permanently diluting shareholders, just to shore up its balance sheet. Having said that, the most common situation is where a company manages its debt reasonably well - and to its own advantage. When we think about a company's use of debt, we first look at cash and debt together.
See our latest analysis for Winnebago Industries
What Is Winnebago Industries's Debt?
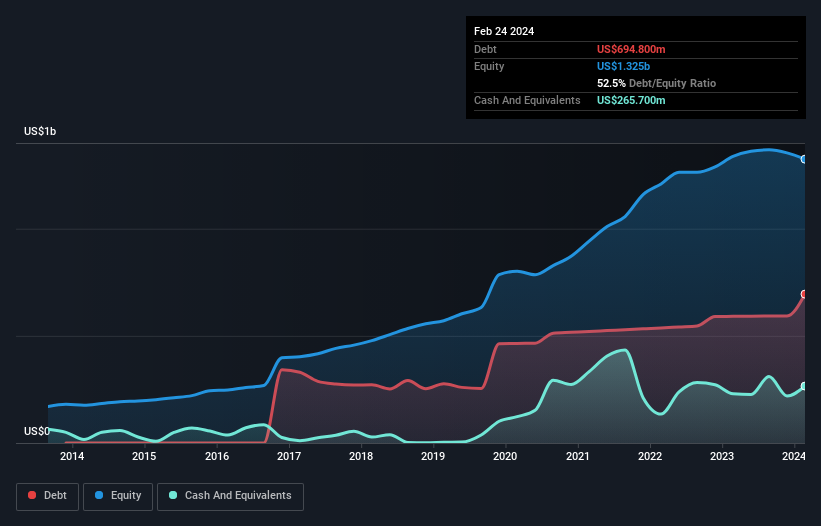
The image below, which you can click on for greater detail, shows that at February 2024 Winnebago Industries had debt of US$694.8m, up from US$591.0m in one year. However, it does have US$265.7m in cash offsetting this, leading to net debt of about US$429.1m.
How Strong Is Winnebago Industries' Balance Sheet?
The latest balance sheet data shows that Winnebago Industries had liabilities of US$353.2m due within a year, and liabilities of US$756.1m falling due after that. On the other hand, it had cash of US$265.7m and US$242.3m worth of receivables due within a year. So its liabilities outweigh the sum of its cash and (near-term) receivables by US$601.3m.
Winnebago Industries has a market capitalization of US$1.75b, so it could very likely raise cash to ameliorate its balance sheet, if the need arose. But it's clear that we should definitely closely examine whether it can manage its debt without dilution.
We use two main ratios to inform us about debt levels relative to earnings. The first is net debt divided by earnings before interest, tax, depreciation, and amortization (EBITDA), while the second is how many times its earnings before interest and tax (EBIT) covers its interest expense (or its interest cover, for short). Thus we consider debt relative to earnings both with and without depreciation and amortization expenses.
We'd say that Winnebago Industries's moderate net debt to EBITDA ratio ( being 1.6), indicates prudence when it comes to debt. And its strong interest cover of 11.5 times, makes us even more comfortable. In fact Winnebago Industries's saving grace is its low debt levels, because its EBIT has tanked 54% in the last twelve months. Falling earnings (if the trend continues) could eventually make even modest debt quite risky. The balance sheet is clearly the area to focus on when you are analysing debt. But it is future earnings, more than anything, that will determine Winnebago Industries's ability to maintain a healthy balance sheet going forward. So if you're focused on the future you can check out this free report showing analyst profit forecasts.
Finally, a business needs free cash flow to pay off debt; accounting profits just don't cut it. So the logical step is to look at the proportion of that EBIT that is matched by actual free cash flow. During the last three years, Winnebago Industries produced sturdy free cash flow equating to 55% of its EBIT, about what we'd expect. This free cash flow puts the company in a good position to pay down debt, when appropriate.
Our View
Winnebago Industries's EBIT growth rate was a real negative on this analysis, although the other factors we considered cast it in a significantly better light. For example its interest cover was refreshing. We think that Winnebago Industries's debt does make it a bit risky, after considering the aforementioned data points together. That's not necessarily a bad thing, since leverage can boost returns on equity, but it is something to be aware of. When analysing debt levels, the balance sheet is the obvious place to start. But ultimately, every company can contain risks that exist outside of the balance sheet. Be aware that Winnebago Industries is showing 1 warning sign in our investment analysis , you should know about...
If, after all that, you're more interested in a fast growing company with a rock-solid balance sheet, then check out our list of net cash growth stocks without delay.
Valuation is complex, but we're here to simplify it.
Discover if Winnebago Industries might be undervalued or overvalued with our detailed analysis, featuring fair value estimates, potential risks, dividends, insider trades, and its financial condition.
Access Free AnalysisHave feedback on this article? Concerned about the content? Get in touch with us directly. Alternatively, email editorial-team (at) simplywallst.com.
This article by Simply Wall St is general in nature. We provide commentary based on historical data and analyst forecasts only using an unbiased methodology and our articles are not intended to be financial advice. It does not constitute a recommendation to buy or sell any stock, and does not take account of your objectives, or your financial situation. We aim to bring you long-term focused analysis driven by fundamental data. Note that our analysis may not factor in the latest price-sensitive company announcements or qualitative material. Simply Wall St has no position in any stocks mentioned.
About NYSE:WGO
Winnebago Industries
Manufactures and sells recreation vehicles and marine products primarily for use in leisure travel and outdoor recreation activities.
Adequate balance sheet average dividend payer.
Similar Companies
Market Insights

Advertisement
Community Narratives
Vita Life Sciences Set for a 12.72% Revenue Growth While Tackling Operational Challenges
Fair Value AU$2.42|8.7% undervalued
RO
Community Contributor
Vossloh rides a €500 billion wave to boost growth and earnings in the next decade
Fair Value €78.41|6.3% undervalued
CH
Community Contributor
Intuitive Surgical Will Transform Healthcare with 12% Revenue Growth
Fair Value US$325.55|56.5% overvalued
UN
Community Contributor