Stock Analysis
- United States
- /
- Auto
- /
- NYSE:HOG
Despite the downward trend in earnings at Harley-Davidson (NYSE:HOG) the stock climbs 6.5%, bringing one-year gains to 21%

We believe investing is smart because history shows that stock markets go higher in the long term. But not every stock you buy will perform as well as the overall market. Unfortunately for shareholders, while the Harley-Davidson, Inc. (NYSE:HOG) share price is up 19% in the last year, that falls short of the market return. Looking back further, the share price is 19% higher than it was three years ago.
Since the stock has added US$363m to its market cap in the past week alone, let's see if underlying performance has been driving long-term returns.
Check out our latest analysis for Harley-Davidson
While the efficient markets hypothesis continues to be taught by some, it has been proven that markets are over-reactive dynamic systems, and investors are not always rational. One imperfect but simple way to consider how the market perception of a company has shifted is to compare the change in the earnings per share (EPS) with the share price movement.
Over the last twelve months, Harley-Davidson actually shrank its EPS by 0.9%.
We don't think that the decline in earnings per share is a good measure of the business over the last twelve months. Since the change in EPS doesn't seem to correlate with the change in share price, it's worth taking a look at other metrics.
We are skeptical of the suggestion that the 1.6% dividend yield would entice buyers to the stock. Revenue was pretty stable on last year, so deeper research might be needed to explain the share price rise.
The image below shows how earnings and revenue have tracked over time (if you click on the image you can see greater detail).
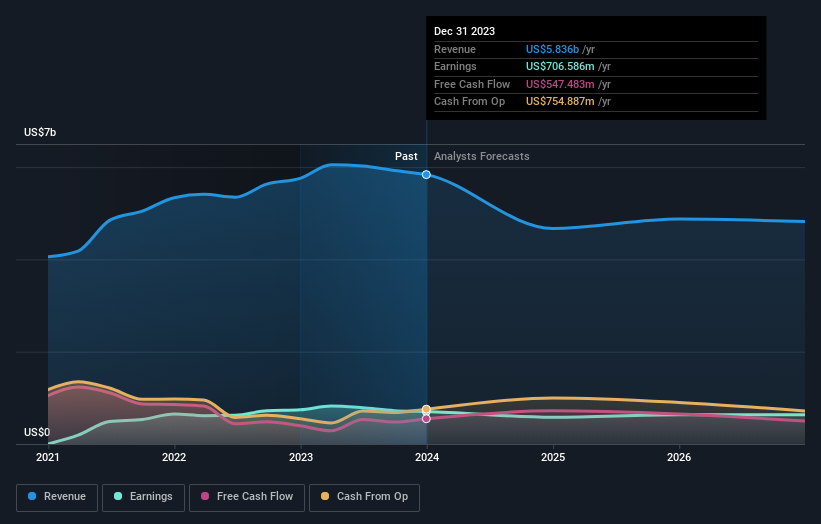
Harley-Davidson is a well known stock, with plenty of analyst coverage, suggesting some visibility into future growth. If you are thinking of buying or selling Harley-Davidson stock, you should check out this free report showing analyst consensus estimates for future profits.
What About Dividends?
When looking at investment returns, it is important to consider the difference between total shareholder return (TSR) and share price return. The TSR is a return calculation that accounts for the value of cash dividends (assuming that any dividend received was reinvested) and the calculated value of any discounted capital raisings and spin-offs. It's fair to say that the TSR gives a more complete picture for stocks that pay a dividend. In the case of Harley-Davidson, it has a TSR of 21% for the last 1 year. That exceeds its share price return that we previously mentioned. And there's no prize for guessing that the dividend payments largely explain the divergence!
A Different Perspective
Harley-Davidson shareholders gained a total return of 21% during the year. But that was short of the market average. The silver lining is that the gain was actually better than the average annual return of 5% per year over five year. This could indicate that the company is winning over new investors, as it pursues its strategy. It's always interesting to track share price performance over the longer term. But to understand Harley-Davidson better, we need to consider many other factors. Consider for instance, the ever-present spectre of investment risk. We've identified 3 warning signs with Harley-Davidson (at least 2 which shouldn't be ignored) , and understanding them should be part of your investment process.
If you like to buy stocks alongside management, then you might just love this free list of companies. (Hint: insiders have been buying them).
Please note, the market returns quoted in this article reflect the market weighted average returns of stocks that currently trade on American exchanges.
Valuation is complex, but we're helping make it simple.
Find out whether Harley-Davidson is potentially over or undervalued by checking out our comprehensive analysis, which includes fair value estimates, risks and warnings, dividends, insider transactions and financial health.
View the Free AnalysisHave feedback on this article? Concerned about the content? Get in touch with us directly. Alternatively, email editorial-team (at) simplywallst.com.
This article by Simply Wall St is general in nature. We provide commentary based on historical data and analyst forecasts only using an unbiased methodology and our articles are not intended to be financial advice. It does not constitute a recommendation to buy or sell any stock, and does not take account of your objectives, or your financial situation. We aim to bring you long-term focused analysis driven by fundamental data. Note that our analysis may not factor in the latest price-sensitive company announcements or qualitative material. Simply Wall St has no position in any stocks mentioned.
About NYSE:HOG
Harley-Davidson
Harley-Davidson, Inc. manufactures and sells motorcycles in the United States and internationally.
Very undervalued with mediocre balance sheet.

