
Advertisement
- United States
- /
- Auto Components
- /
- NasdaqGS:VC
Is Visteon Corporation's (NASDAQ:VC) Balance Sheet A Threat To Its Future?

Small-cap and large-cap companies receive a lot of attention from investors, but mid-cap stocks like Visteon Corporation (NASDAQ:VC), with a market cap of US$2.3b, are often out of the spotlight. Despite this, commonly overlooked mid-caps have historically produced better risk-adjusted returns than their small and large-cap counterparts. Let’s take a look at VC’s debt concentration and assess their financial liquidity to get an idea of their ability to fund strategic acquisitions and grow through cyclical pressures. Note that this information is centred entirely on financial health and is a top-level understanding, so I encourage you to look further into VC here.
See our latest analysis for Visteon
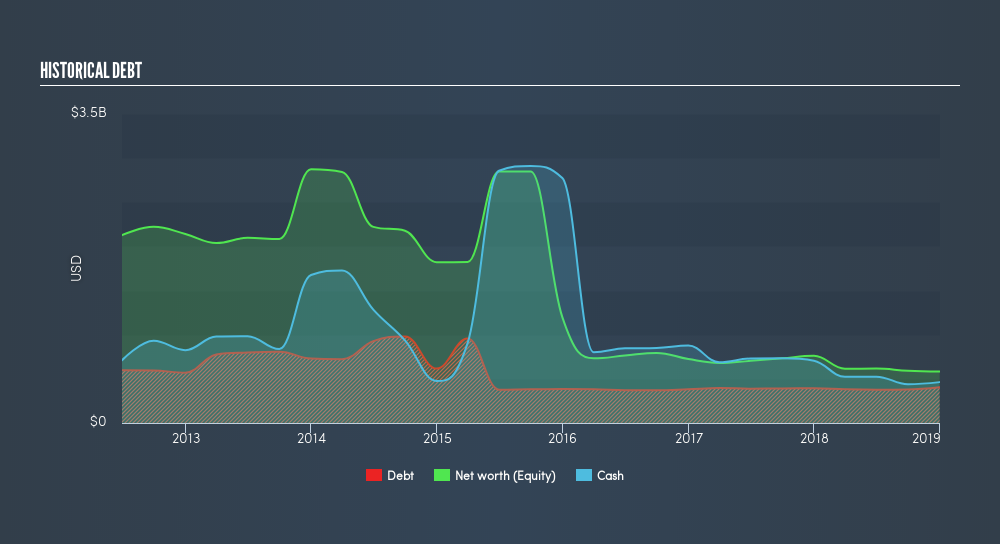
VC’s Debt (And Cash Flows)
VC has sustained its debt level by about US$405m over the last 12 months – this includes long-term debt. At this constant level of debt, VC's cash and short-term investments stands at US$463m to keep the business going. Additionally, VC has produced cash from operations of US$204m over the same time period, leading to an operating cash to total debt ratio of 50%, signalling that VC’s current level of operating cash is high enough to cover debt.
Can VC meet its short-term obligations with the cash in hand?
At the current liabilities level of US$721m, it appears that the company has been able to meet these obligations given the level of current assets of US$1.3b, with a current ratio of 1.8x. The current ratio is calculated by dividing current assets by current liabilities. For Auto Components companies, this ratio is within a sensible range as there's enough of a cash buffer without holding too much capital in low return investments.
Does VC face the risk of succumbing to its debt-load?
With debt reaching 70% of equity, VC may be thought of as relatively highly levered. This is not unusual for mid-caps as debt tends to be a cheaper and faster source of funding for some businesses. We can check to see whether VC is able to meet its debt obligations by looking at the net interest coverage ratio. A company generating earnings before interest and tax (EBIT) at least three times its net interest payments is considered financially sound. In VC's, case, the ratio of 31.57x suggests that interest is comfortably covered, which means that lenders may be inclined to lend more money to the company, as it is seen as safe in terms of payback.
Next Steps:
VC’s high cash coverage means that, although its debt levels are high, the company is able to utilise its borrowings efficiently in order to generate cash flow. Since there is also no concerns around VC's liquidity needs, this may be its optimal capital structure for the time being. This is only a rough assessment of financial health, and I'm sure VC has company-specific issues impacting its capital structure decisions. I suggest you continue to research Visteon to get a more holistic view of the mid-cap by looking at:
- Future Outlook: What are well-informed industry analysts predicting for VC’s future growth? Take a look at our free research report of analyst consensus for VC’s outlook.
- Valuation: What is VC worth today? Is the stock undervalued, even when its growth outlook is factored into its intrinsic value? The intrinsic value infographic in our free research report helps visualize whether VC is currently mispriced by the market.
- Other High-Performing Stocks: Are there other stocks that provide better prospects with proven track records? Explore our free list of these great stocks here.
We aim to bring you long-term focused research analysis driven by fundamental data. Note that our analysis may not factor in the latest price-sensitive company announcements or qualitative material.
If you spot an error that warrants correction, please contact the editor at editorial-team@simplywallst.com. This article by Simply Wall St is general in nature. It does not constitute a recommendation to buy or sell any stock, and does not take account of your objectives, or your financial situation. Simply Wall St has no position in the stocks mentioned. Thank you for reading.
About NasdaqGS:VC
Visteon
An automotive technology company, designs, manufactures, and sells automotive electronics and connected car solutions for vehicle manufacturers.
Flawless balance sheet and good value.
Similar Companies
Market Insights


Advertisement
Community Narratives
For the Emperor: Why Games Workshop Could Be a Star Investment
Fair Value UK£160.00|0.5% overvalued
RO
Community Contributor
Securitas will boost margins with AI and tech-driven services
Fair Value SEK 260.91|44.9% undervalued
UN
Community Contributor
A Leader in EV Charging with Growth Potential
Fair Value €27.00|21.3% undervalued
TI
Community Contributor