
Advertisement
- Taiwan
- /
- Electronic Equipment and Components
- /
- TWSE:3167
Ta Liang Technology (TWSE:3167) investors are up 11% in the past week, but earnings have declined over the last five years

Buying shares in the best businesses can build meaningful wealth for you and your family. While not every stock performs well, when investors win, they can win big. To wit, the Ta Liang Technology Co., Ltd. (TWSE:3167) share price has soared 414% over five years. If that doesn't get you thinking about long term investing, we don't know what will. It's also good to see the share price up 143% over the last quarter.
The past week has proven to be lucrative for Ta Liang Technology investors, so let's see if fundamentals drove the company's five-year performance.
See our latest analysis for Ta Liang Technology
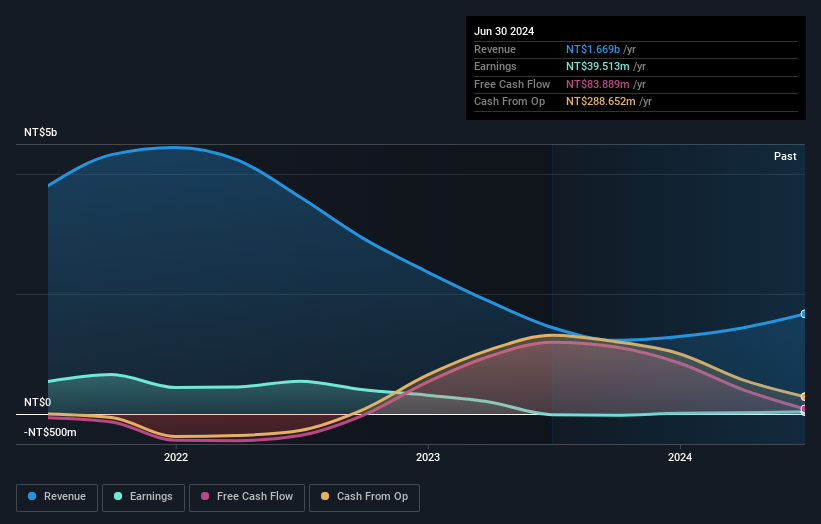
While Ta Liang Technology made a small profit, in the last year, we think that the market is probably more focussed on the top line growth at the moment. As a general rule, we think this kind of company is more comparable to loss-making stocks, since the actual profit is so low. For shareholders to have confidence a company will grow profits significantly, it must grow revenue.
Over the last half decade Ta Liang Technology's revenue has actually been trending down at about 6.9% per year. This is in stark contrast to the strong share price growth of 39%, compound, per year. There can be no doubt this kind of decoupling of revenue growth and share price growth is unusual to see in loss making companies. At the risk of upsetting holders, this does suggest that hope for a better future is playing a significant role in the share price action.
You can see how earnings and revenue have changed over time in the image below (click on the chart to see the exact values).
If you are thinking of buying or selling Ta Liang Technology stock, you should check out this FREE detailed report on its balance sheet.
What About Dividends?
It is important to consider the total shareholder return, as well as the share price return, for any given stock. The TSR incorporates the value of any spin-offs or discounted capital raisings, along with any dividends, based on the assumption that the dividends are reinvested. Arguably, the TSR gives a more comprehensive picture of the return generated by a stock. We note that for Ta Liang Technology the TSR over the last 5 years was 540%, which is better than the share price return mentioned above. And there's no prize for guessing that the dividend payments largely explain the divergence!
A Different Perspective
It's nice to see that Ta Liang Technology shareholders have received a total shareholder return of 215% over the last year. And that does include the dividend. Since the one-year TSR is better than the five-year TSR (the latter coming in at 45% per year), it would seem that the stock's performance has improved in recent times. Given the share price momentum remains strong, it might be worth taking a closer look at the stock, lest you miss an opportunity. I find it very interesting to look at share price over the long term as a proxy for business performance. But to truly gain insight, we need to consider other information, too. To that end, you should learn about the 3 warning signs we've spotted with Ta Liang Technology (including 2 which are potentially serious) .
If you are like me, then you will not want to miss this free list of undervalued small caps that insiders are buying.
Please note, the market returns quoted in this article reflect the market weighted average returns of stocks that currently trade on Taiwanese exchanges.
Valuation is complex, but we're here to simplify it.
Discover if Ta Liang Technology might be undervalued or overvalued with our detailed analysis, featuring fair value estimates, potential risks, dividends, insider trades, and its financial condition.
Access Free AnalysisHave feedback on this article? Concerned about the content? Get in touch with us directly. Alternatively, email editorial-team (at) simplywallst.com.
This article by Simply Wall St is general in nature. We provide commentary based on historical data and analyst forecasts only using an unbiased methodology and our articles are not intended to be financial advice. It does not constitute a recommendation to buy or sell any stock, and does not take account of your objectives, or your financial situation. We aim to bring you long-term focused analysis driven by fundamental data. Note that our analysis may not factor in the latest price-sensitive company announcements or qualitative material. Simply Wall St has no position in any stocks mentioned.
About TWSE:3167
Ta Liang Technology
Engages in the manufacturing of semiconductor inspection, PCB routing and drilling machines, resin panel cutters, CNC engraving and milling machines, and glass panel processing machines in Taiwan.
Excellent balance sheet with acceptable track record.
Similar Companies
Market Insights


Advertisement
Community Narratives
MicroStrategy: Volatile Gamble or Golden Opportunity?
Fair Value US$663.00|33.3% undervalued
BL
Community Contributor
Emerging Markets and Debt Reduction Will Propel Bath & Body Works Forward
Fair Value US$40.73|23.4% undervalued
ZW
Community Contributor
An amazing opportunity to potentially get a 100 bagger
Fair Value US$10.00|8.5% overvalued
DA
Community Contributor