- Taiwan
- /
- Electronic Equipment and Components
- /
- TWSE:6153
Did Career Technology (Mfg.)'s (TPE:6153) Share Price Deserve to Gain 65%?

If you buy and hold a stock for many years, you'd hope to be making a profit. But more than that, you probably want to see it rise more than the market average. Unfortunately for shareholders, while the Career Technology (Mfg.) Co., Ltd. (TPE:6153) share price is up 65% in the last five years, that's less than the market return. Zooming in, the stock is up a respectable 11% in the last year.
View our latest analysis for Career Technology (Mfg.)
While the efficient markets hypothesis continues to be taught by some, it has been proven that markets are over-reactive dynamic systems, and investors are not always rational. One imperfect but simple way to consider how the market perception of a company has shifted is to compare the change in the earnings per share (EPS) with the share price movement.
Career Technology (Mfg.)'s earnings per share are down 14% per year, despite strong share price performance over five years.
Essentially, it doesn't seem likely that investors are focused on EPS. Because earnings per share don't seem to match up with the share price, we'll take a look at other metrics instead.
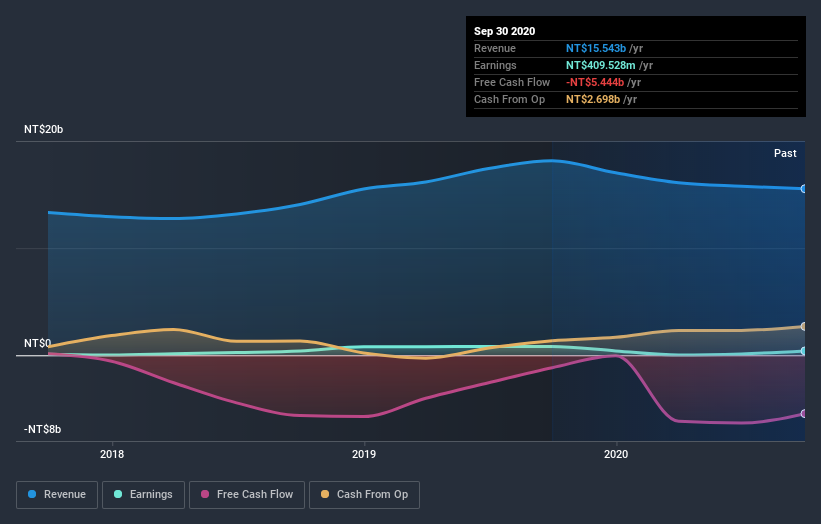
The modest 0.1% dividend yield is unlikely to be propping up the share price. The revenue growth of 2.3% per year hardly seems impressive. So it seems one might have to take closer look at earnings and revenue trends to see how they might influence the share price.
You can see below how earnings and revenue have changed over time (discover the exact values by clicking on the image).
If you are thinking of buying or selling Career Technology (Mfg.) stock, you should check out this FREE detailed report on its balance sheet.
What About Dividends?
When looking at investment returns, it is important to consider the difference between total shareholder return (TSR) and share price return. Whereas the share price return only reflects the change in the share price, the TSR includes the value of dividends (assuming they were reinvested) and the benefit of any discounted capital raising or spin-off. So for companies that pay a generous dividend, the TSR is often a lot higher than the share price return. As it happens, Career Technology (Mfg.)'s TSR for the last 5 years was 81%, which exceeds the share price return mentioned earlier. This is largely a result of its dividend payments!
A Different Perspective
Career Technology (Mfg.) provided a TSR of 11% over the last twelve months. But that return falls short of the market. On the bright side, the longer term returns (running at about 13% a year, over half a decade) look better. It may well be that this is a business worth popping on the watching, given the continuing positive reception, over time, from the market. While it is well worth considering the different impacts that market conditions can have on the share price, there are other factors that are even more important. Even so, be aware that Career Technology (Mfg.) is showing 3 warning signs in our investment analysis , and 1 of those shouldn't be ignored...
Of course, you might find a fantastic investment by looking elsewhere. So take a peek at this free list of companies we expect will grow earnings.
Please note, the market returns quoted in this article reflect the market weighted average returns of stocks that currently trade on TW exchanges.
If you’re looking to trade Career Technology (Mfg.), open an account with the lowest-cost* platform trusted by professionals, Interactive Brokers. Their clients from over 200 countries and territories trade stocks, options, futures, forex, bonds and funds worldwide from a single integrated account. Promoted
The New Payments ETF Is Live on NASDAQ:
Money is moving to real-time rails, and a newly listed ETF now gives investors direct exposure. Fast settlement. Institutional custody. Simple access.
Explore how this launch could reshape portfolios
Sponsored ContentNew: AI Stock Screener & Alerts
Our new AI Stock Screener scans the market every day to uncover opportunities.
• Dividend Powerhouses (3%+ Yield)
• Undervalued Small Caps with Insider Buying
• High growth Tech and AI Companies
Or build your own from over 50 metrics.
This article by Simply Wall St is general in nature. It does not constitute a recommendation to buy or sell any stock, and does not take account of your objectives, or your financial situation. We aim to bring you long-term focused analysis driven by fundamental data. Note that our analysis may not factor in the latest price-sensitive company announcements or qualitative material. Simply Wall St has no position in any stocks mentioned.
*Interactive Brokers Rated Lowest Cost Broker by StockBrokers.com Annual Online Review 2020
Have feedback on this article? Concerned about the content? Get in touch with us directly. Alternatively, email editorial-team (at) simplywallst.com.
About TWSE:6153
Career Technology (Mfg.)
Engages in the design, research and development, manufacturing and processing, trading, and import and export of flexible printed circuits in Taiwan, China, the United States, and internationally.
Flawless balance sheet with very low risk.
Similar Companies
Market Insights

Weekly Picks

Early mover in a fast growing industry. Likely to experience share price volatility as they scale


A case for CA$31.80 (undiluted), aka 8,616% upside from CA$0.37 (an 86 bagger!).


Moderation and Stabilisation: HOLD: Fair Price based on a 4-year Cycle is $12.08
Recently Updated Narratives

Airbnb Stock: Platform Growth in a World of Saturation and Scrutiny

Adobe Stock: AI-Fueled ARR Growth Pushes Guidance Higher, But Cost Pressures Loom

Thomson Reuters Stock: When Legal Intelligence Becomes Mission-Critical Infrastructure
Popular Narratives


Crazy Undervalued 42 Baggers Silver Play (Active & Running Mine)


NVDA: Expanding AI Demand Will Drive Major Data Center Investments Through 2026

The AI Infrastructure Giant Grows Into Its Valuation
Trending Discussion


