- Taiwan
- /
- Semiconductors
- /
- TWSE:6756
VIA Labs, Inc. (TWSE:6756) Stock's Been Sliding But Fundamentals Look Decent: Will The Market Correct The Share Price In The Future?

With its stock down 11% over the past week, it is easy to disregard VIA Labs (TWSE:6756). However, stock prices are usually driven by a company’s financials over the long term, which in this case look pretty respectable. Particularly, we will be paying attention to VIA Labs' ROE today.
Return on equity or ROE is a key measure used to assess how efficiently a company's management is utilizing the company's capital. In short, ROE shows the profit each dollar generates with respect to its shareholder investments.
View our latest analysis for VIA Labs
How Is ROE Calculated?
ROE can be calculated by using the formula:
Return on Equity = Net Profit (from continuing operations) ÷ Shareholders' Equity
So, based on the above formula, the ROE for VIA Labs is:
7.5% = NT$214m ÷ NT$2.9b (Based on the trailing twelve months to September 2023).
The 'return' is the amount earned after tax over the last twelve months. Another way to think of that is that for every NT$1 worth of equity, the company was able to earn NT$0.07 in profit.
What Has ROE Got To Do With Earnings Growth?
We have already established that ROE serves as an efficient profit-generating gauge for a company's future earnings. Based on how much of its profits the company chooses to reinvest or "retain", we are then able to evaluate a company's future ability to generate profits. Assuming everything else remains unchanged, the higher the ROE and profit retention, the higher the growth rate of a company compared to companies that don't necessarily bear these characteristics.
VIA Labs' Earnings Growth And 7.5% ROE
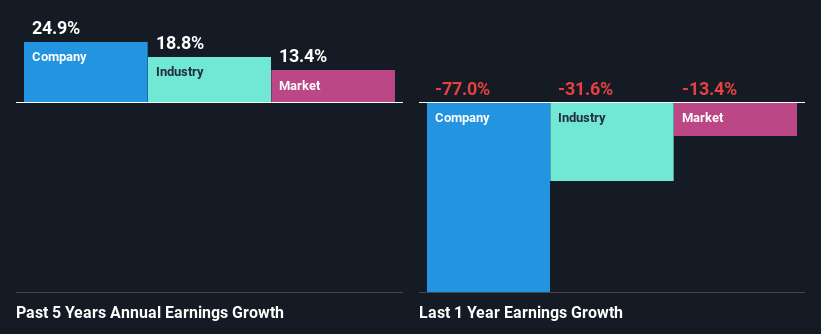
On the face of it, VIA Labs' ROE is not much to talk about. A quick further study shows that the company's ROE doesn't compare favorably to the industry average of 10% either. However, we we're pleasantly surprised to see that VIA Labs grew its net income at a significant rate of 25% in the last five years. So, there might be other aspects that are positively influencing the company's earnings growth. Such as - high earnings retention or an efficient management in place.
We then compared VIA Labs' net income growth with the industry and we're pleased to see that the company's growth figure is higher when compared with the industry which has a growth rate of 19% in the same 5-year period.
Earnings growth is a huge factor in stock valuation. It’s important for an investor to know whether the market has priced in the company's expected earnings growth (or decline). Doing so will help them establish if the stock's future looks promising or ominous. One good indicator of expected earnings growth is the P/E ratio which determines the price the market is willing to pay for a stock based on its earnings prospects. So, you may want to check if VIA Labs is trading on a high P/E or a low P/E, relative to its industry.
Is VIA Labs Using Its Retained Earnings Effectively?
VIA Labs' significant three-year median payout ratio of 76% (where it is retaining only 24% of its income) suggests that the company has been able to achieve a high growth in earnings despite returning most of its income to shareholders.
Additionally, VIA Labs has paid dividends over a period of four years which means that the company is pretty serious about sharing its profits with shareholders.
Conclusion
In total, it does look like VIA Labs has some positive aspects to its business. That is, quite an impressive growth in earnings. However, the low profit retention means that the company's earnings growth could have been higher, had it been reinvesting a higher portion of its profits. So far, we've only made a quick discussion around the company's earnings growth. You can do your own research on VIA Labs and see how it has performed in the past by looking at this FREE detailed graph of past earnings, revenue and cash flows.
The New Payments ETF Is Live on NASDAQ:
Money is moving to real-time rails, and a newly listed ETF now gives investors direct exposure. Fast settlement. Institutional custody. Simple access.
Explore how this launch could reshape portfolios
Sponsored ContentNew: Manage All Your Stock Portfolios in One Place
We've created the ultimate portfolio companion for stock investors, and it's free.
• Connect an unlimited number of Portfolios and see your total in one currency
• Be alerted to new Warning Signs or Risks via email or mobile
• Track the Fair Value of your stocks
Have feedback on this article? Concerned about the content? Get in touch with us directly. Alternatively, email editorial-team (at) simplywallst.com.
This article by Simply Wall St is general in nature. We provide commentary based on historical data and analyst forecasts only using an unbiased methodology and our articles are not intended to be financial advice. It does not constitute a recommendation to buy or sell any stock, and does not take account of your objectives, or your financial situation. We aim to bring you long-term focused analysis driven by fundamental data. Note that our analysis may not factor in the latest price-sensitive company announcements or qualitative material. Simply Wall St has no position in any stocks mentioned.
About TWSE:6756
VIA Labs
Engages in the programming, designing, manufacturing, and sale of USB and USB power delivery controllers for multi-functional devices and platforms in Taiwan, Hong Kong, China, Japan, Europe, and internationally.
Slight risk with mediocre balance sheet.
Similar Companies
Market Insights

Weekly Picks

Early mover in a fast growing industry. Likely to experience share price volatility as they scale


A case for CA$31.80 (undiluted), aka 8,616% upside from CA$0.37 (an 86 bagger!).


Moderation and Stabilisation: HOLD: Fair Price based on a 4-year Cycle is $12.08
Recently Updated Narratives


Title: Market Sentiment Is Dead Wrong — Here's Why PSEC Deserves a Second Look


An amazing opportunity to potentially get a 100 bagger

Amazon: Why the World’s Biggest Platform Still Runs on Invisible Economics
Popular Narratives


MicroVision will explode future revenue by 380.37% with a vision towards success


Crazy Undervalued 42 Baggers Silver Play (Active & Running Mine)


NVDA: Expanding AI Demand Will Drive Major Data Center Investments Through 2026
Trending Discussion
