
Advertisement
- Taiwan
- /
- Semiconductors
- /
- TWSE:6695
iCatch Technology, Inc.'s (TWSE:6695) 28% Dip Still Leaving Some Shareholders Feeling Restless Over Its P/SRatio
The iCatch Technology, Inc. (TWSE:6695) share price has softened a substantial 28% over the previous 30 days, handing back much of the gains the stock has made lately. Still, a bad month hasn't completely ruined the past year with the stock gaining 57%, which is great even in a bull market.
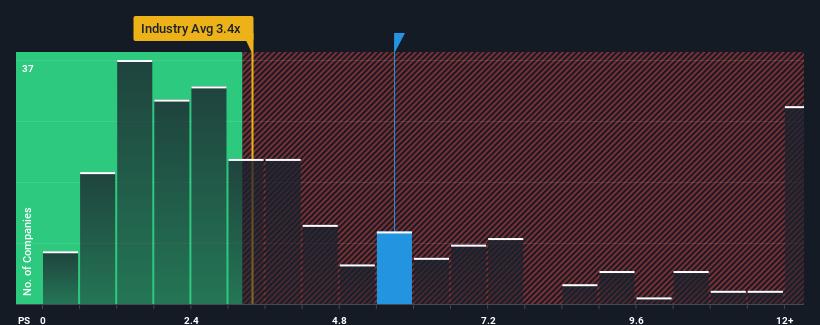
Although its price has dipped substantially, when almost half of the companies in Taiwan's Semiconductor industry have price-to-sales ratios (or "P/S") below 3.4x, you may still consider iCatch Technology as a stock not worth researching with its 5.7x P/S ratio. However, the P/S might be quite high for a reason and it requires further investigation to determine if it's justified.
View our latest analysis for iCatch Technology
How iCatch Technology Has Been Performing
For example, consider that iCatch Technology's financial performance has been pretty ordinary lately as revenue growth is non-existent. Perhaps the market believes that revenue growth will improve markedly over current levels, inflating the P/S ratio. If not, then existing shareholders may be a little nervous about the viability of the share price.
We don't have analyst forecasts, but you can see how recent trends are setting up the company for the future by checking out our free report on iCatch Technology's earnings, revenue and cash flow.Is There Enough Revenue Growth Forecasted For iCatch Technology?
The only time you'd be truly comfortable seeing a P/S as steep as iCatch Technology's is when the company's growth is on track to outshine the industry decidedly.
Taking a look back first, we see that there was hardly any revenue growth to speak of for the company over the past year. However, a few strong years before that means that it was still able to grow revenue by an impressive 45% in total over the last three years. Therefore, it's fair to say the revenue growth recently has been great for the company, but investors will want to ask why it has slowed to such an extent.
Comparing the recent medium-term revenue trends against the industry's one-year growth forecast of 22% shows it's noticeably less attractive.
With this information, we find it concerning that iCatch Technology is trading at a P/S higher than the industry. It seems most investors are ignoring the fairly limited recent growth rates and are hoping for a turnaround in the company's business prospects. There's a good chance existing shareholders are setting themselves up for future disappointment if the P/S falls to levels more in line with recent growth rates.
What We Can Learn From iCatch Technology's P/S?
A significant share price dive has done very little to deflate iCatch Technology's very lofty P/S. We'd say the price-to-sales ratio's power isn't primarily as a valuation instrument but rather to gauge current investor sentiment and future expectations.
Our examination of iCatch Technology revealed its poor three-year revenue trends aren't detracting from the P/S as much as we though, given they look worse than current industry expectations. When we see slower than industry revenue growth but an elevated P/S, there's considerable risk of the share price declining, sending the P/S lower. Unless the recent medium-term conditions improve markedly, it's very challenging to accept these the share price as being reasonable.
You always need to take note of risks, for example - iCatch Technology has 1 warning sign we think you should be aware of.
Of course, profitable companies with a history of great earnings growth are generally safer bets. So you may wish to see this free collection of other companies that have reasonable P/E ratios and have grown earnings strongly.
Valuation is complex, but we're here to simplify it.
Discover if iCatch Technology might be undervalued or overvalued with our detailed analysis, featuring fair value estimates, potential risks, dividends, insider trades, and its financial condition.
Access Free AnalysisHave feedback on this article? Concerned about the content? Get in touch with us directly. Alternatively, email editorial-team (at) simplywallst.com.
This article by Simply Wall St is general in nature. We provide commentary based on historical data and analyst forecasts only using an unbiased methodology and our articles are not intended to be financial advice. It does not constitute a recommendation to buy or sell any stock, and does not take account of your objectives, or your financial situation. We aim to bring you long-term focused analysis driven by fundamental data. Note that our analysis may not factor in the latest price-sensitive company announcements or qualitative material. Simply Wall St has no position in any stocks mentioned.
About TWSE:6695
iCatch Technology
Researches, develops, designs, manufactures, and sells IC products for digital and automotive imaging, and home security monitoring image processing related products.
Flawless balance sheet with very low risk.
Similar Companies
Market Insights

Advertisement
Community Narratives
MINISO's fair value is projected at 26.69 with an anticipated PE ratio shift of 20x
Fair Value US$24.03|11.0% undervalued
BE
Community Contributor
Procter & Gamble: A Dividend Giant Facing Slowing Growth
Fair Value US$119.81|23.3% overvalued
AN
Community Contributor
Eli Lilly's Future Growth Driven by Tirzepatide and Favorable Market Conditions
Fair Value US$1.19k|13.8% undervalued
EA
Community Contributor