Stock Analysis
- Taiwan
- /
- Semiconductors
- /
- TWSE:5434
Topco ScientificLtd's (TWSE:5434) five-year earnings growth trails the 35% YoY shareholder returns


When you buy shares in a company, it's worth keeping in mind the possibility that it could fail, and you could lose your money. But on a lighter note, a good company can see its share price rise well over 100%. For example, the Topco Scientific Co.,Ltd. (TWSE:5434) share price has soared 234% in the last half decade. Most would be very happy with that. On top of that, the share price is up 30% in about a quarter.
Since it's been a strong week for Topco ScientificLtd shareholders, let's have a look at trend of the longer term fundamentals.
See our latest analysis for Topco ScientificLtd
While the efficient markets hypothesis continues to be taught by some, it has been proven that markets are over-reactive dynamic systems, and investors are not always rational. One flawed but reasonable way to assess how sentiment around a company has changed is to compare the earnings per share (EPS) with the share price.
During five years of share price growth, Topco ScientificLtd achieved compound earnings per share (EPS) growth of 13% per year. This EPS growth is slower than the share price growth of 27% per year, over the same period. So it's fair to assume the market has a higher opinion of the business than it did five years ago. And that's hardly shocking given the track record of growth.
The graphic below depicts how EPS has changed over time (unveil the exact values by clicking on the image).
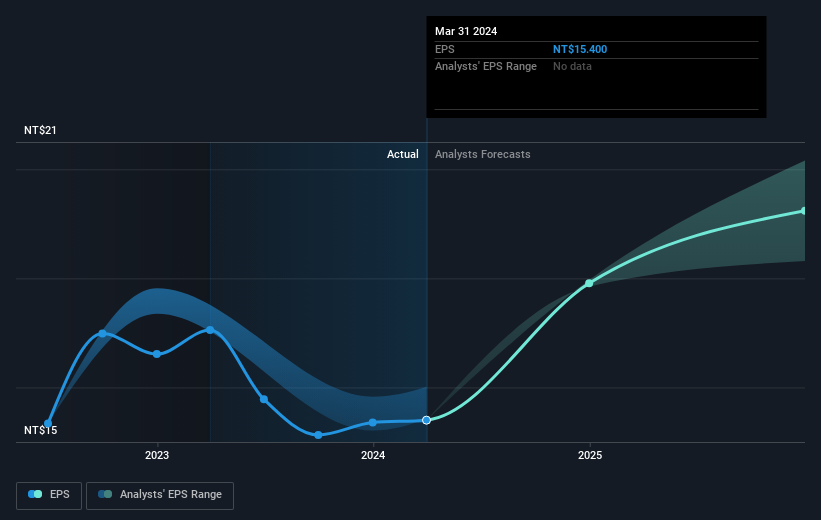
This free interactive report on Topco ScientificLtd's earnings, revenue and cash flow is a great place to start, if you want to investigate the stock further.
What About Dividends?
It is important to consider the total shareholder return, as well as the share price return, for any given stock. The TSR incorporates the value of any spin-offs or discounted capital raisings, along with any dividends, based on the assumption that the dividends are reinvested. Arguably, the TSR gives a more comprehensive picture of the return generated by a stock. We note that for Topco ScientificLtd the TSR over the last 5 years was 347%, which is better than the share price return mentioned above. And there's no prize for guessing that the dividend payments largely explain the divergence!
A Different Perspective
We're pleased to report that Topco ScientificLtd shareholders have received a total shareholder return of 46% over one year. Of course, that includes the dividend. That gain is better than the annual TSR over five years, which is 35%. Therefore it seems like sentiment around the company has been positive lately. Someone with an optimistic perspective could view the recent improvement in TSR as indicating that the business itself is getting better with time. I find it very interesting to look at share price over the long term as a proxy for business performance. But to truly gain insight, we need to consider other information, too. Case in point: We've spotted 3 warning signs for Topco ScientificLtd you should be aware of, and 1 of them makes us a bit uncomfortable.
We will like Topco ScientificLtd better if we see some big insider buys. While we wait, check out this free list of undervalued stocks (mostly small caps) with considerable, recent, insider buying.
Please note, the market returns quoted in this article reflect the market weighted average returns of stocks that currently trade on Taiwanese exchanges.
Valuation is complex, but we're helping make it simple.
Find out whether Topco ScientificLtd is potentially over or undervalued by checking out our comprehensive analysis, which includes fair value estimates, risks and warnings, dividends, insider transactions and financial health.
View the Free AnalysisHave feedback on this article? Concerned about the content? Get in touch with us directly. Alternatively, email editorial-team (at) simplywallst.com.
This article by Simply Wall St is general in nature. We provide commentary based on historical data and analyst forecasts only using an unbiased methodology and our articles are not intended to be financial advice. It does not constitute a recommendation to buy or sell any stock, and does not take account of your objectives, or your financial situation. We aim to bring you long-term focused analysis driven by fundamental data. Note that our analysis may not factor in the latest price-sensitive company announcements or qualitative material. Simply Wall St has no position in any stocks mentioned.
About TWSE:5434
Topco ScientificLtd
Provides precision materials, manufacturing equipment, and components for semiconductor, LCD, and LED industries in Taiwan, China, and internationally.
Undervalued with excellent balance sheet and pays a dividend.
