
Advertisement
- Taiwan
- /
- Semiconductors
- /
- TWSE:5434
Is Topco Scientific Co.,Ltd.'s (TWSE:5434) Recent Stock Performance Tethered To Its Strong Fundamentals?

Topco ScientificLtd's (TWSE:5434) stock is up by a considerable 7.1% over the past month. Given the company's impressive performance, we decided to study its financial indicators more closely as a company's financial health over the long-term usually dictates market outcomes. In this article, we decided to focus on Topco ScientificLtd's ROE.
Return on Equity or ROE is a test of how effectively a company is growing its value and managing investors’ money. Put another way, it reveals the company's success at turning shareholder investments into profits.
Check out our latest analysis for Topco ScientificLtd
How Is ROE Calculated?
The formula for ROE is:
Return on Equity = Net Profit (from continuing operations) ÷ Shareholders' Equity
So, based on the above formula, the ROE for Topco ScientificLtd is:
21% = NT$3.2b ÷ NT$16b (Based on the trailing twelve months to June 2024).
The 'return' is the amount earned after tax over the last twelve months. That means that for every NT$1 worth of shareholders' equity, the company generated NT$0.21 in profit.
Why Is ROE Important For Earnings Growth?
Thus far, we have learned that ROE measures how efficiently a company is generating its profits. Depending on how much of these profits the company reinvests or "retains", and how effectively it does so, we are then able to assess a company’s earnings growth potential. Generally speaking, other things being equal, firms with a high return on equity and profit retention, have a higher growth rate than firms that don’t share these attributes.
A Side By Side comparison of Topco ScientificLtd's Earnings Growth And 21% ROE
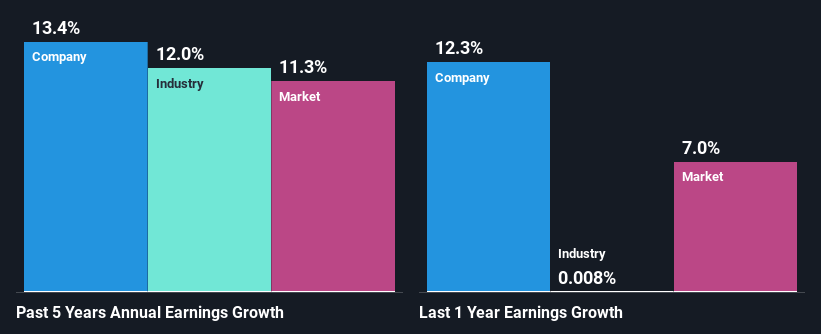
At first glance, Topco ScientificLtd seems to have a decent ROE. Further, the company's ROE compares quite favorably to the industry average of 10%. Probably as a result of this, Topco ScientificLtd was able to see a decent growth of 13% over the last five years.
We then performed a comparison between Topco ScientificLtd's net income growth with the industry, which revealed that the company's growth is similar to the average industry growth of 12% in the same 5-year period.
The basis for attaching value to a company is, to a great extent, tied to its earnings growth. It’s important for an investor to know whether the market has priced in the company's expected earnings growth (or decline). Doing so will help them establish if the stock's future looks promising or ominous. If you're wondering about Topco ScientificLtd's's valuation, check out this gauge of its price-to-earnings ratio, as compared to its industry.
Is Topco ScientificLtd Making Efficient Use Of Its Profits?
Topco ScientificLtd has a significant three-year median payout ratio of 58%, meaning that it is left with only 42% to reinvest into its business. This implies that the company has been able to achieve decent earnings growth despite returning most of its profits to shareholders.
Besides, Topco ScientificLtd has been paying dividends for at least ten years or more. This shows that the company is committed to sharing profits with its shareholders.
Summary
In total, we are pretty happy with Topco ScientificLtd's performance. In particular, its high ROE is quite noteworthy and also the probable explanation behind its considerable earnings growth. Yet, the company is retaining a small portion of its profits. Which means that the company has been able to grow its earnings in spite of it, so that's not too bad. We also studied the latest analyst forecasts and found that the company's earnings growth is expected be similar to its current growth rate. Are these analysts expectations based on the broad expectations for the industry, or on the company's fundamentals? Click here to be taken to our analyst's forecasts page for the company.
Valuation is complex, but we're here to simplify it.
Discover if Topco ScientificLtd might be undervalued or overvalued with our detailed analysis, featuring fair value estimates, potential risks, dividends, insider trades, and its financial condition.
Access Free AnalysisHave feedback on this article? Concerned about the content? Get in touch with us directly. Alternatively, email editorial-team (at) simplywallst.com.
This article by Simply Wall St is general in nature. We provide commentary based on historical data and analyst forecasts only using an unbiased methodology and our articles are not intended to be financial advice. It does not constitute a recommendation to buy or sell any stock, and does not take account of your objectives, or your financial situation. We aim to bring you long-term focused analysis driven by fundamental data. Note that our analysis may not factor in the latest price-sensitive company announcements or qualitative material. Simply Wall St has no position in any stocks mentioned.
About TWSE:5434
Topco ScientificLtd
Provides precision materials, manufacturing equipment, and components worldwide.
Outstanding track record with excellent balance sheet and pays a dividend.
Similar Companies
Market Insights


Advertisement
Community Narratives
For the Emperor: Why Games Workshop Could Be a Star Investment
Fair Value UK£160.00|0.1% overvalued
RO
Community Contributor
Securitas will boost margins with AI and tech-driven services
Fair Value SEK 260.91|44.5% undervalued
UN
Community Contributor
A Leader in EV Charging with Growth Potential
Fair Value €27.00|20.9% undervalued
TI
Community Contributor