
Advertisement
- Taiwan
- /
- Semiconductors
- /
- TWSE:3189
Is Kinsus Interconnect Technology Corp. (TWSE:3189) Trading At A 47% Discount?
Key Insights
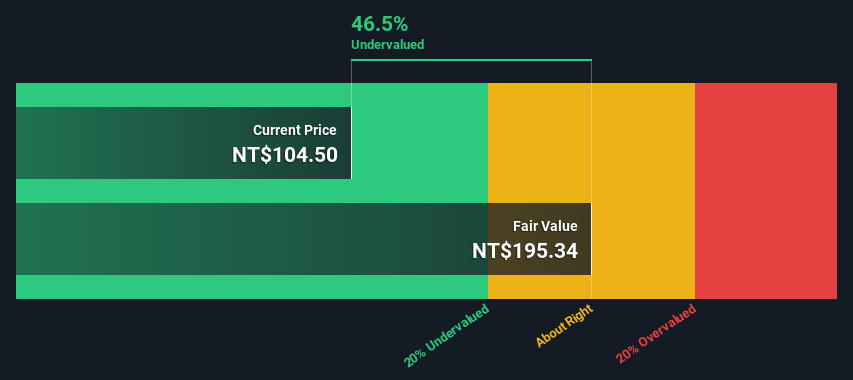
- Kinsus Interconnect Technology's estimated fair value is NT$195 based on 2 Stage Free Cash Flow to Equity
- Current share price of NT$105 suggests Kinsus Interconnect Technology is potentially 47% undervalued
- Our fair value estimate is 80% higher than Kinsus Interconnect Technology's analyst price target of NT$108
Today we'll do a simple run through of a valuation method used to estimate the attractiveness of Kinsus Interconnect Technology Corp. (TWSE:3189) as an investment opportunity by estimating the company's future cash flows and discounting them to their present value. This will be done using the Discounted Cash Flow (DCF) model. There's really not all that much to it, even though it might appear quite complex.
Companies can be valued in a lot of ways, so we would point out that a DCF is not perfect for every situation. Anyone interested in learning a bit more about intrinsic value should have a read of the Simply Wall St analysis model.
Check out our latest analysis for Kinsus Interconnect Technology
The Method
We are going to use a two-stage DCF model, which, as the name states, takes into account two stages of growth. The first stage is generally a higher growth period which levels off heading towards the terminal value, captured in the second 'steady growth' period. In the first stage we need to estimate the cash flows to the business over the next ten years. Where possible we use analyst estimates, but when these aren't available we extrapolate the previous free cash flow (FCF) from the last estimate or reported value. We assume companies with shrinking free cash flow will slow their rate of shrinkage, and that companies with growing free cash flow will see their growth rate slow, over this period. We do this to reflect that growth tends to slow more in the early years than it does in later years.
A DCF is all about the idea that a dollar in the future is less valuable than a dollar today, and so the sum of these future cash flows is then discounted to today's value:
10-year free cash flow (FCF) estimate
| 2025 | 2026 | 2027 | 2028 | 2029 | 2030 | 2031 | 2032 | 2033 | 2034 | |
| Levered FCF (NT$, Millions) | NT$4.23b | NT$5.13b | NT$5.91b | NT$6.56b | NT$7.09b | NT$7.50b | NT$7.84b | NT$8.10b | NT$8.32b | NT$8.50b |
| Growth Rate Estimate Source | Analyst x2 | Est @ 21.35% | Est @ 15.25% | Est @ 10.98% | Est @ 7.99% | Est @ 5.90% | Est @ 4.44% | Est @ 3.41% | Est @ 2.69% | Est @ 2.19% |
| Present Value (NT$, Millions) Discounted @ 8.9% | NT$3.9k | NT$4.3k | NT$4.6k | NT$4.7k | NT$4.6k | NT$4.5k | NT$4.3k | NT$4.1k | NT$3.9k | NT$3.6k |
("Est" = FCF growth rate estimated by Simply Wall St)
Present Value of 10-year Cash Flow (PVCF) = NT$42b
The second stage is also known as Terminal Value, this is the business's cash flow after the first stage. For a number of reasons a very conservative growth rate is used that cannot exceed that of a country's GDP growth. In this case we have used the 5-year average of the 10-year government bond yield (1.0%) to estimate future growth. In the same way as with the 10-year 'growth' period, we discount future cash flows to today's value, using a cost of equity of 8.9%.
Terminal Value (TV)= FCF2034 × (1 + g) ÷ (r – g) = NT$8.5b× (1 + 1.0%) ÷ (8.9%– 1.0%) = NT$109b
Present Value of Terminal Value (PVTV)= TV / (1 + r)10= NT$109b÷ ( 1 + 8.9%)10= NT$46b
The total value, or equity value, is then the sum of the present value of the future cash flows, which in this case is NT$89b. To get the intrinsic value per share, we divide this by the total number of shares outstanding. Relative to the current share price of NT$105, the company appears quite good value at a 47% discount to where the stock price trades currently. Valuations are imprecise instruments though, rather like a telescope - move a few degrees and end up in a different galaxy. Do keep this in mind.
Important Assumptions
We would point out that the most important inputs to a discounted cash flow are the discount rate and of course the actual cash flows. Part of investing is coming up with your own evaluation of a company's future performance, so try the calculation yourself and check your own assumptions. The DCF also does not consider the possible cyclicality of an industry, or a company's future capital requirements, so it does not give a full picture of a company's potential performance. Given that we are looking at Kinsus Interconnect Technology as potential shareholders, the cost of equity is used as the discount rate, rather than the cost of capital (or weighted average cost of capital, WACC) which accounts for debt. In this calculation we've used 8.9%, which is based on a levered beta of 1.628. Beta is a measure of a stock's volatility, compared to the market as a whole. We get our beta from the industry average beta of globally comparable companies, with an imposed limit between 0.8 and 2.0, which is a reasonable range for a stable business.
SWOT Analysis for Kinsus Interconnect Technology
Strength
- Debt is well covered by earnings.
Weakness
- Earnings declined over the past year.
- Dividend is low compared to the top 25% of dividend payers in the Semiconductor market.
Opportunity
- Annual earnings are forecast to grow faster than the Taiwanese market.
- Good value based on P/S ratio and estimated fair value.
Threat
- Debt is not well covered by operating cash flow.
- Dividends are not covered by earnings.
- Revenue is forecast to grow slower than 20% per year.
Moving On:
Although the valuation of a company is important, it shouldn't be the only metric you look at when researching a company. The DCF model is not a perfect stock valuation tool. Instead the best use for a DCF model is to test certain assumptions and theories to see if they would lead to the company being undervalued or overvalued. For example, changes in the company's cost of equity or the risk free rate can significantly impact the valuation. What is the reason for the share price sitting below the intrinsic value? For Kinsus Interconnect Technology, we've put together three essential factors you should further examine:
- Risks: You should be aware of the 2 warning signs for Kinsus Interconnect Technology (1 shouldn't be ignored!) we've uncovered before considering an investment in the company.
- Future Earnings: How does 3189's growth rate compare to its peers and the wider market? Dig deeper into the analyst consensus number for the upcoming years by interacting with our free analyst growth expectation chart.
- Other Solid Businesses: Low debt, high returns on equity and good past performance are fundamental to a strong business. Why not explore our interactive list of stocks with solid business fundamentals to see if there are other companies you may not have considered!
PS. The Simply Wall St app conducts a discounted cash flow valuation for every stock on the TWSE every day. If you want to find the calculation for other stocks just search here.
Valuation is complex, but we're here to simplify it.
Discover if Kinsus Interconnect Technology might be undervalued or overvalued with our detailed analysis, featuring fair value estimates, potential risks, dividends, insider trades, and its financial condition.
Access Free AnalysisHave feedback on this article? Concerned about the content? Get in touch with us directly. Alternatively, email editorial-team (at) simplywallst.com.
This article by Simply Wall St is general in nature. We provide commentary based on historical data and analyst forecasts only using an unbiased methodology and our articles are not intended to be financial advice. It does not constitute a recommendation to buy or sell any stock, and does not take account of your objectives, or your financial situation. We aim to bring you long-term focused analysis driven by fundamental data. Note that our analysis may not factor in the latest price-sensitive company announcements or qualitative material. Simply Wall St has no position in any stocks mentioned.
About TWSE:3189
Kinsus Interconnect Technology
Engages in the manufacture and sale of electronic products in Taiwan and internationally.
Excellent balance sheet with reasonable growth potential.
Market Insights

Advertisement
Community Narratives
MINISO's fair value is projected at 26.69 with an anticipated PE ratio shift of 20x
Fair Value US$24.03|12.0% undervalued
BE
Community Contributor
Procter & Gamble: A Dividend Giant Facing Slowing Growth
Fair Value US$119.81|21.7% overvalued
AN
Community Contributor
Eli Lilly's Future Growth Driven by Tirzepatide and Favorable Market Conditions
Fair Value US$1.19k|14.1% undervalued
EA
Community Contributor