- Taiwan
- /
- Semiconductors
- /
- TWSE:8028
These 4 Measures Indicate That Phoenix Silicon International (TPE:8028) Is Using Debt Extensively

Some say volatility, rather than debt, is the best way to think about risk as an investor, but Warren Buffett famously said that 'Volatility is far from synonymous with risk.' It's only natural to consider a company's balance sheet when you examine how risky it is, since debt is often involved when a business collapses. We can see that Phoenix Silicon International Corporation (TPE:8028) does use debt in its business. But should shareholders be worried about its use of debt?
When Is Debt Dangerous?
Generally speaking, debt only becomes a real problem when a company can't easily pay it off, either by raising capital or with its own cash flow. In the worst case scenario, a company can go bankrupt if it cannot pay its creditors. However, a more frequent (but still costly) occurrence is where a company must issue shares at bargain-basement prices, permanently diluting shareholders, just to shore up its balance sheet. Of course, the upside of debt is that it often represents cheap capital, especially when it replaces dilution in a company with the ability to reinvest at high rates of return. The first thing to do when considering how much debt a business uses is to look at its cash and debt together.
See our latest analysis for Phoenix Silicon International
How Much Debt Does Phoenix Silicon International Carry?
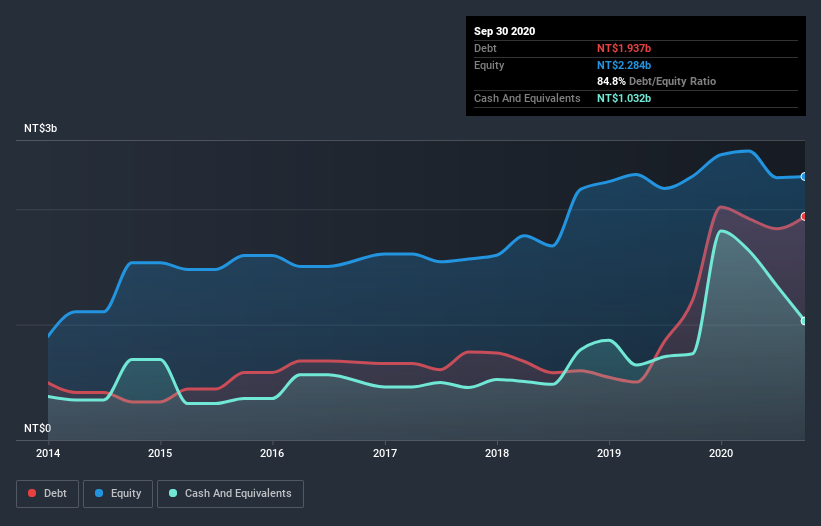
As you can see below, at the end of September 2020, Phoenix Silicon International had NT$1.94b of debt, up from NT$1.21b a year ago. Click the image for more detail. However, it does have NT$1.03b in cash offsetting this, leading to net debt of about NT$905.7m.

How Healthy Is Phoenix Silicon International's Balance Sheet?
Zooming in on the latest balance sheet data, we can see that Phoenix Silicon International had liabilities of NT$832.1m due within 12 months and liabilities of NT$1.92b due beyond that. Offsetting these obligations, it had cash of NT$1.03b as well as receivables valued at NT$470.3m due within 12 months. So its liabilities outweigh the sum of its cash and (near-term) receivables by NT$1.25b.
Since publicly traded Phoenix Silicon International shares are worth a total of NT$7.88b, it seems unlikely that this level of liabilities would be a major threat. But there are sufficient liabilities that we would certainly recommend shareholders continue to monitor the balance sheet, going forward.
In order to size up a company's debt relative to its earnings, we calculate its net debt divided by its earnings before interest, tax, depreciation, and amortization (EBITDA) and its earnings before interest and tax (EBIT) divided by its interest expense (its interest cover). The advantage of this approach is that we take into account both the absolute quantum of debt (with net debt to EBITDA) and the actual interest expenses associated with that debt (with its interest cover ratio).
Phoenix Silicon International has net debt worth 1.6 times EBITDA, which isn't too much, but its interest cover looks a bit on the low side, with EBIT at only 3.8 times the interest expense. It seems that the business incurs large depreciation and amortisation charges, so maybe its debt load is heavier than it would first appear, since EBITDA is arguably a generous measure of earnings. Shareholders should be aware that Phoenix Silicon International's EBIT was down 76% last year. If that earnings trend continues then paying off its debt will be about as easy as herding cats on to a roller coaster. There's no doubt that we learn most about debt from the balance sheet. But it is Phoenix Silicon International's earnings that will influence how the balance sheet holds up in the future. So when considering debt, it's definitely worth looking at the earnings trend. Click here for an interactive snapshot.
But our final consideration is also important, because a company cannot pay debt with paper profits; it needs cold hard cash. So we clearly need to look at whether that EBIT is leading to corresponding free cash flow. Over the last three years, Phoenix Silicon International saw substantial negative free cash flow, in total. While investors are no doubt expecting a reversal of that situation in due course, it clearly does mean its use of debt is more risky.
Our View
To be frank both Phoenix Silicon International's conversion of EBIT to free cash flow and its track record of (not) growing its EBIT make us rather uncomfortable with its debt levels. Having said that, its ability handle its debt, based on its EBITDA, isn't such a worry. Overall, we think it's fair to say that Phoenix Silicon International has enough debt that there are some real risks around the balance sheet. If all goes well, that should boost returns, but on the flip side, the risk of permanent capital loss is elevated by the debt. The balance sheet is clearly the area to focus on when you are analysing debt. However, not all investment risk resides within the balance sheet - far from it. For instance, we've identified 4 warning signs for Phoenix Silicon International that you should be aware of.
When all is said and done, sometimes its easier to focus on companies that don't even need debt. Readers can access a list of growth stocks with zero net debt 100% free, right now.
If you decide to trade Phoenix Silicon International, use the lowest-cost* platform that is rated #1 Overall by Barron’s, Interactive Brokers. Trade stocks, options, futures, forex, bonds and funds on 135 markets, all from a single integrated account. Promoted
New: Manage All Your Stock Portfolios in One Place
We've created the ultimate portfolio companion for stock investors, and it's free.
• Connect an unlimited number of Portfolios and see your total in one currency
• Be alerted to new Warning Signs or Risks via email or mobile
• Track the Fair Value of your stocks
This article by Simply Wall St is general in nature. It does not constitute a recommendation to buy or sell any stock, and does not take account of your objectives, or your financial situation. We aim to bring you long-term focused analysis driven by fundamental data. Note that our analysis may not factor in the latest price-sensitive company announcements or qualitative material. Simply Wall St has no position in any stocks mentioned.
*Interactive Brokers Rated Lowest Cost Broker by StockBrokers.com Annual Online Review 2020
Have feedback on this article? Concerned about the content? Get in touch with us directly. Alternatively, email editorial-team (at) simplywallst.com.
About TWSE:8028
Phoenix Silicon International
Engages in the research, development, manufacture, export, import, and sale of wafers in Taiwan.
Mediocre balance sheet with questionable track record.
Similar Companies
Market Insights
Community Narratives


