Is Weakness In KENT Industrial Co., Ltd (GTSM:6606) Stock A Sign That The Market Could be Wrong Given Its Strong Financial Prospects?


It is hard to get excited after looking at KENT Industrial's (GTSM:6606) recent performance, when its stock has declined 14% over the past three months. However, stock prices are usually driven by a company’s financial performance over the long term, which in this case looks quite promising. Specifically, we decided to study KENT Industrial's ROE in this article.
Return on Equity or ROE is a test of how effectively a company is growing its value and managing investors’ money. In other words, it is a profitability ratio which measures the rate of return on the capital provided by the company's shareholders.
Check out our latest analysis for KENT Industrial
How To Calculate Return On Equity?
The formula for ROE is:
Return on Equity = Net Profit (from continuing operations) ÷ Shareholders' Equity
So, based on the above formula, the ROE for KENT Industrial is:
26% = NT$388m ÷ NT$1.5b (Based on the trailing twelve months to June 2020).
The 'return' refers to a company's earnings over the last year. One way to conceptualize this is that for each NT$1 of shareholders' capital it has, the company made NT$0.26 in profit.
What Is The Relationship Between ROE And Earnings Growth?
We have already established that ROE serves as an efficient profit-generating gauge for a company's future earnings. Based on how much of its profits the company chooses to reinvest or "retain", we are then able to evaluate a company's future ability to generate profits. Assuming all else is equal, companies that have both a higher return on equity and higher profit retention are usually the ones that have a higher growth rate when compared to companies that don't have the same features.
KENT Industrial's Earnings Growth And 26% ROE
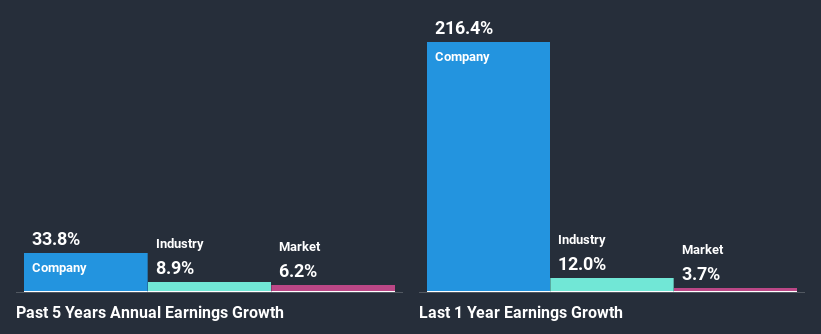
Firstly, we acknowledge that KENT Industrial has a significantly high ROE. Additionally, the company's ROE is higher compared to the industry average of 11% which is quite remarkable. So, the substantial 34% net income growth seen by KENT Industrial over the past five years isn't overly surprising.
Next, on comparing with the industry net income growth, we found that KENT Industrial's growth is quite high when compared to the industry average growth of 8.9% in the same period, which is great to see.
Earnings growth is an important metric to consider when valuing a stock. The investor should try to establish if the expected growth or decline in earnings, whichever the case may be, is priced in. By doing so, they will have an idea if the stock is headed into clear blue waters or if swampy waters await. One good indicator of expected earnings growth is the P/E ratio which determines the price the market is willing to pay for a stock based on its earnings prospects. So, you may want to check if KENT Industrial is trading on a high P/E or a low P/E, relative to its industry.
Is KENT Industrial Efficiently Re-investing Its Profits?
KENT Industrial's significant three-year median payout ratio of 72% (where it is retaining only 28% of its income) suggests that the company has been able to achieve a high growth in earnings despite returning most of its income to shareholders.
Along with seeing a growth in earnings, KENT Industrial only recently started paying dividends. Its quite possible that the company was looking to impress its shareholders.
Conclusion
On the whole, we feel that KENT Industrial's performance has been quite good. In particular, its high ROE is quite noteworthy and also the probable explanation behind its considerable earnings growth. Yet, the company is retaining a small portion of its profits. Which means that the company has been able to grow its earnings in spite of it, so that's not too bad. Up till now, we've only made a short study of the company's growth data. You can do your own research on KENT Industrial and see how it has performed in the past by looking at this FREE detailed graph of past earnings, revenue and cash flows.
When trading KENT Industrial or any other investment, use the platform considered by many to be the Professional's Gateway to the Worlds Market, Interactive Brokers. You get the lowest-cost* trading on stocks, options, futures, forex, bonds and funds worldwide from a single integrated account. Promoted
Valuation is complex, but we're here to simplify it.
Discover if KENT IndustrialLtd might be undervalued or overvalued with our detailed analysis, featuring fair value estimates, potential risks, dividends, insider trades, and its financial condition.
Access Free AnalysisThis article by Simply Wall St is general in nature. It does not constitute a recommendation to buy or sell any stock, and does not take account of your objectives, or your financial situation. We aim to bring you long-term focused analysis driven by fundamental data. Note that our analysis may not factor in the latest price-sensitive company announcements or qualitative material. Simply Wall St has no position in any stocks mentioned.
*Interactive Brokers Rated Lowest Cost Broker by StockBrokers.com Annual Online Review 2020
Have feedback on this article? Concerned about the content? Get in touch with us directly. Alternatively, email editorial-team@simplywallst.com.
About TWSE:6606
KENT IndustrialLtd
Engages in the design, manufacturing, and sale of various precision mechanical work machines, tool steel dies, and other products in Taiwan, Asia, the United States, and internationally.
Flawless balance sheet slight.
Market Insights

Community Narratives

