- Taiwan
- /
- Semiconductors
- /
- TPEX:6485
The Returns At ASolid Technology (GTSM:6485) Provide Us With Signs Of What's To Come

Finding a business that has the potential to grow substantially is not easy, but it is possible if we look at a few key financial metrics. Firstly, we'll want to see a proven return on capital employed (ROCE) that is increasing, and secondly, an expanding base of capital employed. This shows us that it's a compounding machine, able to continually reinvest its earnings back into the business and generate higher returns. However, after investigating ASolid Technology (GTSM:6485), we don't think it's current trends fit the mold of a multi-bagger.
Return On Capital Employed (ROCE): What is it?
Just to clarify if you're unsure, ROCE is a metric for evaluating how much pre-tax income (in percentage terms) a company earns on the capital invested in its business. Analysts use this formula to calculate it for ASolid Technology:
Return on Capital Employed = Earnings Before Interest and Tax (EBIT) ÷ (Total Assets - Current Liabilities)
0.012 = NT$12m ÷ (NT$1.3b - NT$325m) (Based on the trailing twelve months to September 2020).
So, ASolid Technology has an ROCE of 1.2%. In absolute terms, that's a low return and it also under-performs the Semiconductor industry average of 10%.
View our latest analysis for ASolid Technology
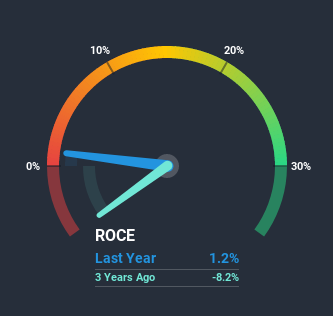
Historical performance is a great place to start when researching a stock so above you can see the gauge for ASolid Technology's ROCE against it's prior returns. If you'd like to look at how ASolid Technology has performed in the past in other metrics, you can view this free graph of past earnings, revenue and cash flow.
What The Trend Of ROCE Can Tell Us
When we looked at the ROCE trend at ASolid Technology, we didn't gain much confidence. Over the last five years, returns on capital have decreased to 1.2% from 14% five years ago. Given the business is employing more capital while revenue has slipped, this is a bit concerning. This could mean that the business is losing its competitive advantage or market share, because while more money is being put into ventures, it's actually producing a lower return - "less bang for their buck" per se.
On a side note, ASolid Technology's current liabilities have increased over the last five years to 25% of total assets, effectively distorting the ROCE to some degree. Without this increase, it's likely that ROCE would be even lower than 1.2%. While the ratio isn't currently too high, it's worth keeping an eye on this because if it gets particularly high, the business could then face some new elements of risk.In Conclusion...
We're a bit apprehensive about ASolid Technology because despite more capital being deployed in the business, returns on that capital and sales have both fallen. Despite the concerning underlying trends, the stock has actually gained 9.1% over the last five years, so it might be that the investors are expecting the trends to reverse. Regardless, we don't like the trends as they are and if they persist, we think you might find better investments elsewhere.
If you want to know some of the risks facing ASolid Technology we've found 5 warning signs (1 can't be ignored!) that you should be aware of before investing here.
While ASolid Technology isn't earning the highest return, check out this free list of companies that are earning high returns on equity with solid balance sheets.
When trading ASolid Technology or any other investment, use the platform considered by many to be the Professional's Gateway to the Worlds Market, Interactive Brokers. You get the lowest-cost* trading on stocks, options, futures, forex, bonds and funds worldwide from a single integrated account. Promoted
The New Payments ETF Is Live on NASDAQ:
Money is moving to real-time rails, and a newly listed ETF now gives investors direct exposure. Fast settlement. Institutional custody. Simple access.
Explore how this launch could reshape portfolios
Sponsored ContentNew: Manage All Your Stock Portfolios in One Place
We've created the ultimate portfolio companion for stock investors, and it's free.
• Connect an unlimited number of Portfolios and see your total in one currency
• Be alerted to new Warning Signs or Risks via email or mobile
• Track the Fair Value of your stocks
This article by Simply Wall St is general in nature. It does not constitute a recommendation to buy or sell any stock, and does not take account of your objectives, or your financial situation. We aim to bring you long-term focused analysis driven by fundamental data. Note that our analysis may not factor in the latest price-sensitive company announcements or qualitative material. Simply Wall St has no position in any stocks mentioned.
*Interactive Brokers Rated Lowest Cost Broker by StockBrokers.com Annual Online Review 2020
Have feedback on this article? Concerned about the content? Get in touch with us directly. Alternatively, email editorial-team (at) simplywallst.com.
About TPEX:6485
ASolid Technology
Operates as a NAND flash controller provider in Taiwan.
Excellent balance sheet and good value.
Similar Companies
Market Insights

Weekly Picks

Early mover in a fast growing industry. Likely to experience share price volatility as they scale


A case for CA$31.80 (undiluted), aka 8,616% upside from CA$0.37 (an 86 bagger!).


Moderation and Stabilisation: HOLD: Fair Price based on a 4-year Cycle is $12.08
Recently Updated Narratives


An amazing opportunity to potentially get a 100 bagger

Amazon: Why the World’s Biggest Platform Still Runs on Invisible Economics

Sunrun Stock: When the Energy Transition Collides With the Cost of Capital
Popular Narratives


MicroVision will explode future revenue by 380.37% with a vision towards success


Crazy Undervalued 42 Baggers Silver Play (Active & Running Mine)

