- Taiwan
- /
- Semiconductors
- /
- TPEX:3691
Does Giga Solar Materials' (GTSM:3691) Returns On Capital Reflect Well On The Business?


When researching a stock for investment, what can tell us that the company is in decline? A business that's potentially in decline often shows two trends, a return on capital employed (ROCE) that's declining, and a base of capital employed that's also declining. Ultimately this means that the company is earning less per dollar invested and on top of that, it's shrinking its base of capital employed. So after we looked into Giga Solar Materials (GTSM:3691), the trends above didn't look too great.
Understanding Return On Capital Employed (ROCE)
Just to clarify if you're unsure, ROCE is a metric for evaluating how much pre-tax income (in percentage terms) a company earns on the capital invested in its business. To calculate this metric for Giga Solar Materials, this is the formula:
Return on Capital Employed = Earnings Before Interest and Tax (EBIT) ÷ (Total Assets - Current Liabilities)
0.032 = NT$229m ÷ (NT$12b - NT$5.1b) (Based on the trailing twelve months to September 2020).
Thus, Giga Solar Materials has an ROCE of 3.2%. In absolute terms, that's a low return and it also under-performs the Semiconductor industry average of 10%.
See our latest analysis for Giga Solar Materials
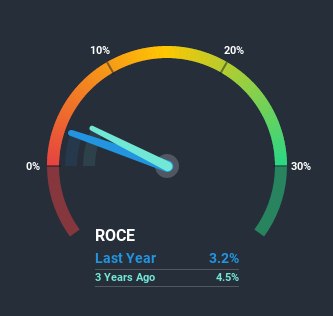
Above you can see how the current ROCE for Giga Solar Materials compares to its prior returns on capital, but there's only so much you can tell from the past. If you're interested, you can view the analysts predictions in our free report on analyst forecasts for the company.
What The Trend Of ROCE Can Tell Us
We are a bit worried about the trend of returns on capital at Giga Solar Materials. About five years ago, returns on capital were 29%, however they're now substantially lower than that as we saw above. On top of that, it's worth noting that the amount of capital employed within the business has remained relatively steady. Companies that exhibit these attributes tend to not be shrinking, but they can be mature and facing pressure on their margins from competition. So because these trends aren't typically conducive to creating a multi-bagger, we wouldn't hold our breath on Giga Solar Materials becoming one if things continue as they have.
While on the subject, we noticed that the ratio of current liabilities to total assets has risen to 41%, which has impacted the ROCE. Without this increase, it's likely that ROCE would be even lower than 3.2%. And with current liabilities at these levels, suppliers or short-term creditors are effectively funding a large part of the business, which can introduce some risks.What We Can Learn From Giga Solar Materials' ROCE
In the end, the trend of lower returns on the same amount of capital isn't typically an indication that we're looking at a growth stock. We expect this has contributed to the stock plummeting 71% during the last five years. With underlying trends that aren't great in these areas, we'd consider looking elsewhere.
One final note, you should learn about the 4 warning signs we've spotted with Giga Solar Materials (including 2 which is are potentially serious) .
While Giga Solar Materials isn't earning the highest return, check out this free list of companies that are earning high returns on equity with solid balance sheets.
When trading Giga Solar Materials or any other investment, use the platform considered by many to be the Professional's Gateway to the Worlds Market, Interactive Brokers. You get the lowest-cost* trading on stocks, options, futures, forex, bonds and funds worldwide from a single integrated account. Promoted
New: Manage All Your Stock Portfolios in One Place
We've created the ultimate portfolio companion for stock investors, and it's free.
• Connect an unlimited number of Portfolios and see your total in one currency
• Be alerted to new Warning Signs or Risks via email or mobile
• Track the Fair Value of your stocks
This article by Simply Wall St is general in nature. It does not constitute a recommendation to buy or sell any stock, and does not take account of your objectives, or your financial situation. We aim to bring you long-term focused analysis driven by fundamental data. Note that our analysis may not factor in the latest price-sensitive company announcements or qualitative material. Simply Wall St has no position in any stocks mentioned.
*Interactive Brokers Rated Lowest Cost Broker by StockBrokers.com Annual Online Review 2020
Have feedback on this article? Concerned about the content? Get in touch with us directly. Alternatively, email editorial-team@simplywallst.com.
About TPEX:3691
Giga Solar Materials
Manufactures and sells photovoltaic cell conductive pastes in Asia, Europe, and the United States.
Adequate balance sheet and slightly overvalued.
Similar Companies
Market Insights

Community Narratives

