
Advertisement
Is momo.com Inc.'s (TWSE:8454) Recent Performance Tethered To Its Attractive Financial Prospects?
momo.com's (TWSE:8454) stock up by 9.0% over the past three months. Given its impressive performance, we decided to study the company's key financial indicators as a company's long-term fundamentals usually dictate market outcomes. In this article, we decided to focus on momo.com's ROE.
Return on Equity or ROE is a test of how effectively a company is growing its value and managing investors’ money. Put another way, it reveals the company's success at turning shareholder investments into profits.
View our latest analysis for momo.com
How To Calculate Return On Equity?
ROE can be calculated by using the formula:
Return on Equity = Net Profit (from continuing operations) ÷ Shareholders' Equity
So, based on the above formula, the ROE for momo.com is:
32% = NT$3.6b ÷ NT$11b (Based on the trailing twelve months to March 2024).
The 'return' is the income the business earned over the last year. So, this means that for every NT$1 of its shareholder's investments, the company generates a profit of NT$0.32.
What Is The Relationship Between ROE And Earnings Growth?
So far, we've learned that ROE is a measure of a company's profitability. We now need to evaluate how much profit the company reinvests or "retains" for future growth which then gives us an idea about the growth potential of the company. Generally speaking, other things being equal, firms with a high return on equity and profit retention, have a higher growth rate than firms that don’t share these attributes.
A Side By Side comparison of momo.com's Earnings Growth And 32% ROE
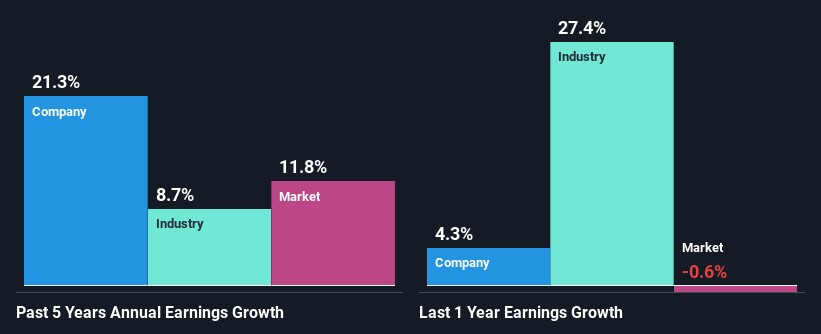
First thing first, we like that momo.com has an impressive ROE. Additionally, the company's ROE is higher compared to the industry average of 13% which is quite remarkable. So, the substantial 21% net income growth seen by momo.com over the past five years isn't overly surprising.
Next, on comparing with the industry net income growth, we found that momo.com's growth is quite high when compared to the industry average growth of 8.7% in the same period, which is great to see.
Earnings growth is an important metric to consider when valuing a stock. The investor should try to establish if the expected growth or decline in earnings, whichever the case may be, is priced in. This then helps them determine if the stock is placed for a bright or bleak future. What is 8454 worth today? The intrinsic value infographic in our free research report helps visualize whether 8454 is currently mispriced by the market.
Is momo.com Efficiently Re-investing Its Profits?
momo.com has a significant three-year median payout ratio of 72%, meaning the company only retains 28% of its income. This implies that the company has been able to achieve high earnings growth despite returning most of its profits to shareholders.
Besides, momo.com has been paying dividends for at least ten years or more. This shows that the company is committed to sharing profits with its shareholders. Based on the latest analysts' estimates, we found that the company's future payout ratio over the next three years is expected to hold steady at 76%. Therefore, the company's future ROE is also not expected to change by much with analysts predicting an ROE of 38%.
Summary
In total, we are pretty happy with momo.com's performance. In particular, its high ROE is quite noteworthy and also the probable explanation behind its considerable earnings growth. Yet, the company is retaining a small portion of its profits. Which means that the company has been able to grow its earnings in spite of it, so that's not too bad. That being so, a study of the latest analyst forecasts show that the company is expected to see a slowdown in its future earnings growth. Are these analysts expectations based on the broad expectations for the industry, or on the company's fundamentals? Click here to be taken to our analyst's forecasts page for the company.
New: AI Stock Screener & Alerts
Our new AI Stock Screener scans the market every day to uncover opportunities.
• Dividend Powerhouses (3%+ Yield)
• Undervalued Small Caps with Insider Buying
• High growth Tech and AI Companies
Or build your own from over 50 metrics.
Have feedback on this article? Concerned about the content? Get in touch with us directly. Alternatively, email editorial-team (at) simplywallst.com.
This article by Simply Wall St is general in nature. We provide commentary based on historical data and analyst forecasts only using an unbiased methodology and our articles are not intended to be financial advice. It does not constitute a recommendation to buy or sell any stock, and does not take account of your objectives, or your financial situation. We aim to bring you long-term focused analysis driven by fundamental data. Note that our analysis may not factor in the latest price-sensitive company announcements or qualitative material. Simply Wall St has no position in any stocks mentioned.
Have feedback on this article? Concerned about the content? Get in touch with us directly. Alternatively, email editorial-team@simplywallst.com
About TWSE:8454
momo.com
Engages in the TV and radio production, radio and TV program distribution, radio and TV commercial, video program distribution, issuing of magazine, and retailing businesses in Taiwan.
Excellent balance sheet with acceptable track record.
Similar Companies
Market Insights

Advertisement
Community Narratives
MicroVision will explode future revenue by 380.37% with a vision towards success
Fair Value US$60.00|98.4% undervalued
TH
Community Contributor
The Indispensable Artery for a New North American Economy
Fair Value CA$132.87|1.3% undervalued
TI
Community Contributor