
Advertisement
Some say volatility, rather than debt, is the best way to think about risk as an investor, but Warren Buffett famously said that 'Volatility is far from synonymous with risk.' It's only natural to consider a company's balance sheet when you examine how risky it is, since debt is often involved when a business collapses. As with many other companies Hong Pu Real Estate Development Co., Ltd. (TWSE:2536) makes use of debt. But should shareholders be worried about its use of debt?
When Is Debt Dangerous?
Debt and other liabilities become risky for a business when it cannot easily fulfill those obligations, either with free cash flow or by raising capital at an attractive price. Part and parcel of capitalism is the process of 'creative destruction' where failed businesses are mercilessly liquidated by their bankers. However, a more usual (but still expensive) situation is where a company must dilute shareholders at a cheap share price simply to get debt under control. Of course, plenty of companies use debt to fund growth, without any negative consequences. The first step when considering a company's debt levels is to consider its cash and debt together.
View our latest analysis for Hong Pu Real Estate Development
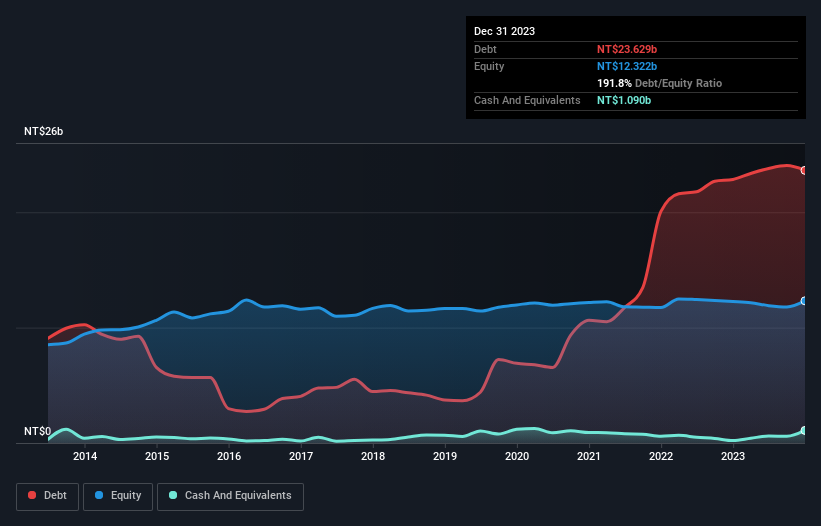
How Much Debt Does Hong Pu Real Estate Development Carry?
The chart below, which you can click on for greater detail, shows that Hong Pu Real Estate Development had NT$23.6b in debt in December 2023; about the same as the year before. However, it does have NT$1.09b in cash offsetting this, leading to net debt of about NT$22.5b.
How Healthy Is Hong Pu Real Estate Development's Balance Sheet?
According to the last reported balance sheet, Hong Pu Real Estate Development had liabilities of NT$25.5b due within 12 months, and liabilities of NT$4.07b due beyond 12 months. Offsetting these obligations, it had cash of NT$1.09b as well as receivables valued at NT$294.7m due within 12 months. So its liabilities outweigh the sum of its cash and (near-term) receivables by NT$28.2b.
The deficiency here weighs heavily on the NT$11.6b company itself, as if a child were struggling under the weight of an enormous back-pack full of books, his sports gear, and a trumpet. So we definitely think shareholders need to watch this one closely. At the end of the day, Hong Pu Real Estate Development would probably need a major re-capitalization if its creditors were to demand repayment.
In order to size up a company's debt relative to its earnings, we calculate its net debt divided by its earnings before interest, tax, depreciation, and amortization (EBITDA) and its earnings before interest and tax (EBIT) divided by its interest expense (its interest cover). The advantage of this approach is that we take into account both the absolute quantum of debt (with net debt to EBITDA) and the actual interest expenses associated with that debt (with its interest cover ratio).
Hong Pu Real Estate Development shareholders face the double whammy of a high net debt to EBITDA ratio (32.2), and fairly weak interest coverage, since EBIT is just 1.5 times the interest expense. The debt burden here is substantial. The silver lining is that Hong Pu Real Estate Development grew its EBIT by 125% last year, which nourishing like the idealism of youth. If that earnings trend continues it will make its debt load much more manageable in the future. When analysing debt levels, the balance sheet is the obvious place to start. But you can't view debt in total isolation; since Hong Pu Real Estate Development will need earnings to service that debt. So if you're keen to discover more about its earnings, it might be worth checking out this graph of its long term earnings trend.
Finally, a company can only pay off debt with cold hard cash, not accounting profits. So it's worth checking how much of that EBIT is backed by free cash flow. Over the last three years, Hong Pu Real Estate Development saw substantial negative free cash flow, in total. While that may be a result of expenditure for growth, it does make the debt far more risky.
Our View
To be frank both Hong Pu Real Estate Development's conversion of EBIT to free cash flow and its track record of staying on top of its total liabilities make us rather uncomfortable with its debt levels. But on the bright side, its EBIT growth rate is a good sign, and makes us more optimistic. We're quite clear that we consider Hong Pu Real Estate Development to be really rather risky, as a result of its balance sheet health. For this reason we're pretty cautious about the stock, and we think shareholders should keep a close eye on its liquidity. The balance sheet is clearly the area to focus on when you are analysing debt. But ultimately, every company can contain risks that exist outside of the balance sheet. Case in point: We've spotted 2 warning signs for Hong Pu Real Estate Development you should be aware of.
At the end of the day, it's often better to focus on companies that are free from net debt. You can access our special list of such companies (all with a track record of profit growth). It's free.
Valuation is complex, but we're here to simplify it.
Discover if Hong Pu Real Estate Development might be undervalued or overvalued with our detailed analysis, featuring fair value estimates, potential risks, dividends, insider trades, and its financial condition.
Access Free AnalysisHave feedback on this article? Concerned about the content? Get in touch with us directly. Alternatively, email editorial-team (at) simplywallst.com.
This article by Simply Wall St is general in nature. We provide commentary based on historical data and analyst forecasts only using an unbiased methodology and our articles are not intended to be financial advice. It does not constitute a recommendation to buy or sell any stock, and does not take account of your objectives, or your financial situation. We aim to bring you long-term focused analysis driven by fundamental data. Note that our analysis may not factor in the latest price-sensitive company announcements or qualitative material. Simply Wall St has no position in any stocks mentioned.
About TWSE:2536
Hong Pu Real Estate Development
Hong Pu Real Estate Development Co., Ltd.
Acceptable track record second-rate dividend payer.
Similar Companies
Market Insights

Advertisement
Community Narratives
Finding The True Value Of A Logistics Powerhouse
Fair Value US$95.21|7.5% undervalued
NV
Community Contributor
Paradigm Biopharmaceuticals Will Lead Osteoarthritis Treatment with Zilosul's FDA Success
Fair Value AU$5.50|91.8% undervalued
AM
Community Contributor
Barrick Mining (ABX:CA): A Gold Hedge against a U.S. Shutdown
Fair Value CA$60.00|26.4% undervalued
GM
Community Contributor