Declining Stock and Decent Financials: Is The Market Wrong About SYN-TECH Chem. & Pharm. Co., Ltd. (GTSM:1777)?


SYN-TECH Chem. & Pharm (GTSM:1777) has had a rough month with its share price down 1.2%. However, stock prices are usually driven by a company’s financials over the long term, which in this case look pretty respectable. Particularly, we will be paying attention to SYN-TECH Chem. & Pharm's ROE today.
Return on equity or ROE is an important factor to be considered by a shareholder because it tells them how effectively their capital is being reinvested. Simply put, it is used to assess the profitability of a company in relation to its equity capital.
View our latest analysis for SYN-TECH Chem. & Pharm
How Is ROE Calculated?
Return on equity can be calculated by using the formula:
Return on Equity = Net Profit (from continuing operations) ÷ Shareholders' Equity
So, based on the above formula, the ROE for SYN-TECH Chem. & Pharm is:
15% = NT$183m ÷ NT$1.2b (Based on the trailing twelve months to September 2020).
The 'return' is the yearly profit. Another way to think of that is that for every NT$1 worth of equity, the company was able to earn NT$0.15 in profit.
What Has ROE Got To Do With Earnings Growth?
We have already established that ROE serves as an efficient profit-generating gauge for a company's future earnings. Depending on how much of these profits the company reinvests or "retains", and how effectively it does so, we are then able to assess a company’s earnings growth potential. Assuming all else is equal, companies that have both a higher return on equity and higher profit retention are usually the ones that have a higher growth rate when compared to companies that don't have the same features.
SYN-TECH Chem. & Pharm's Earnings Growth And 15% ROE
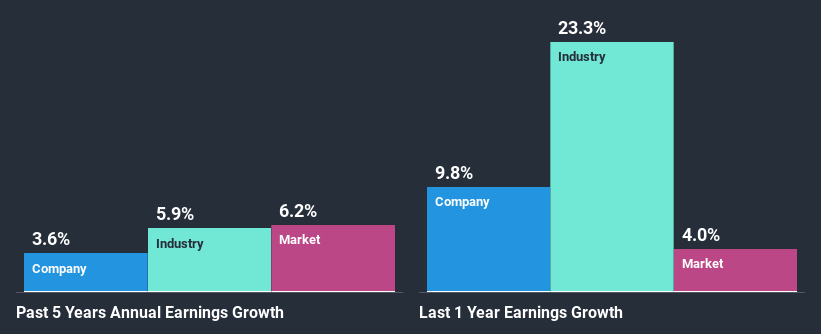
At first glance, SYN-TECH Chem. & Pharm seems to have a decent ROE. On comparing with the average industry ROE of 8.1% the company's ROE looks pretty remarkable. However, for some reason, the higher returns aren't reflected in SYN-TECH Chem. & Pharm's meagre five year net income growth average of 3.6%. This is interesting as the high returns should mean that the company has the ability to generate high growth but for some reason, it hasn't been able to do so. We reckon that a low growth, when returns are quite high could be the result of certain circumstances like low earnings retention or poor allocation of capital.
As a next step, we compared SYN-TECH Chem. & Pharm's net income growth with the industry and were disappointed to see that the company's growth is lower than the industry average growth of 5.9% in the same period.
Earnings growth is a huge factor in stock valuation. The investor should try to establish if the expected growth or decline in earnings, whichever the case may be, is priced in. Doing so will help them establish if the stock's future looks promising or ominous. If you're wondering about SYN-TECH Chem. & Pharm's's valuation, check out this gauge of its price-to-earnings ratio, as compared to its industry.
Is SYN-TECH Chem. & Pharm Efficiently Re-investing Its Profits?
SYN-TECH Chem. & Pharm has a three-year median payout ratio of 63% (implying that it keeps only 37% of its profits), meaning that it pays out most of its profits to shareholders as dividends, and as a result, the company has seen low earnings growth.
In addition, SYN-TECH Chem. & Pharm has been paying dividends over a period of at least ten years suggesting that keeping up dividend payments is way more important to the management even if it comes at the cost of business growth.
Summary
In total, it does look like SYN-TECH Chem. & Pharm has some positive aspects to its business. However, while the company does have a high ROE, its earnings growth number is quite disappointing. This can be blamed on the fact that it reinvests only a small portion of its profits and pays out the rest as dividends. On studying current analyst estimates, we found that analysts expect the company to continue its recent growth streak. Are these analysts expectations based on the broad expectations for the industry, or on the company's fundamentals? Click here to be taken to our analyst's forecasts page for the company.
If you decide to trade SYN-TECH Chem. & Pharm, use the lowest-cost* platform that is rated #1 Overall by Barron’s, Interactive Brokers. Trade stocks, options, futures, forex, bonds and funds on 135 markets, all from a single integrated account. Promoted
If you're looking to trade SYN-TECH Chem. & Pharm, open an account with the lowest-cost platform trusted by professionals, Interactive Brokers.
With clients in over 200 countries and territories, and access to 160 markets, IBKR lets you trade stocks, options, futures, forex, bonds and funds from a single integrated account.
Enjoy no hidden fees, no account minimums, and FX conversion rates as low as 0.03%, far better than what most brokers offer.
Sponsored ContentNew: Manage All Your Stock Portfolios in One Place
We've created the ultimate portfolio companion for stock investors, and it's free.
• Connect an unlimited number of Portfolios and see your total in one currency
• Be alerted to new Warning Signs or Risks via email or mobile
• Track the Fair Value of your stocks
This article by Simply Wall St is general in nature. It does not constitute a recommendation to buy or sell any stock, and does not take account of your objectives, or your financial situation. We aim to bring you long-term focused analysis driven by fundamental data. Note that our analysis may not factor in the latest price-sensitive company announcements or qualitative material. Simply Wall St has no position in any stocks mentioned.
*Interactive Brokers Rated Lowest Cost Broker by StockBrokers.com Annual Online Review 2020
Have feedback on this article? Concerned about the content? Get in touch with us directly. Alternatively, email editorial-team (at) simplywallst.com.
About TPEX:1777
SYN-TECH Chem. & Pharm
Manufactures and sells active pharmaceutical ingredients (APIs) in Taiwan, Asia, Europe, the Americas, and internationally.
Flawless balance sheet with solid track record and pays a dividend.
Market Insights

Community Narratives

