
Advertisement
- Taiwan
- /
- Metals and Mining
- /
- TWSE:2020
Did You Participate In Any Of Mayer Steel Pipe's (TPE:2020) Fantastic 111% Return ?

When you buy and hold a stock for the long term, you definitely want it to provide a positive return. Better yet, you'd like to see the share price move up more than the market average. But Mayer Steel Pipe Corporation (TPE:2020) has fallen short of that second goal, with a share price rise of 49% over five years, which is below the market return. Looking at the last year alone, the stock is up 17%.
See our latest analysis for Mayer Steel Pipe
In his essay The Superinvestors of Graham-and-Doddsville Warren Buffett described how share prices do not always rationally reflect the value of a business. One way to examine how market sentiment has changed over time is to look at the interaction between a company's share price and its earnings per share (EPS).
During the last half decade, Mayer Steel Pipe became profitable. That would generally be considered a positive, so we'd expect the share price to be up. Given that the company made a profit three years ago, but not five years ago, it is worth looking at the share price returns over the last three years, too. We can see that the Mayer Steel Pipe share price is up 33% in the last three years. In the same period, EPS is up 3.2% per year. Notably, the EPS growth has been slower than the annualised share price gain of 10% over three years. So it's fair to assume the market has a higher opinion of the business than it did three years ago.
You can see below how EPS has changed over time (discover the exact values by clicking on the image).
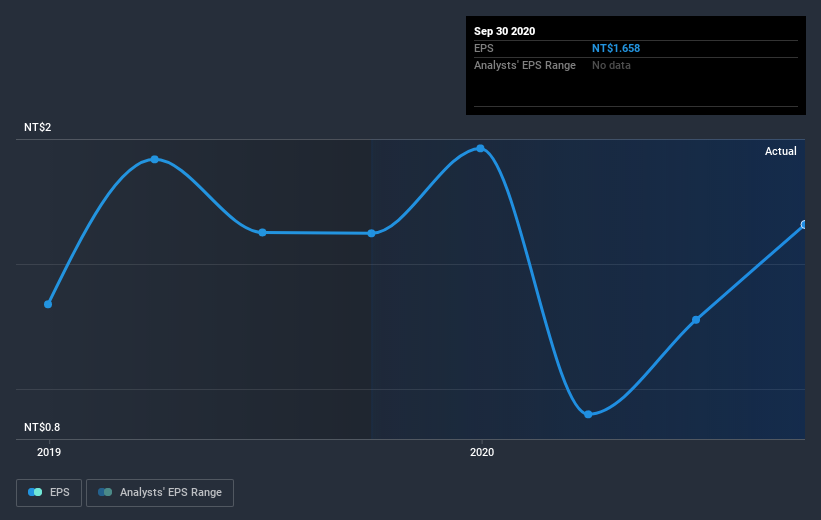
It might be well worthwhile taking a look at our free report on Mayer Steel Pipe's earnings, revenue and cash flow.
What About Dividends?
It is important to consider the total shareholder return, as well as the share price return, for any given stock. Whereas the share price return only reflects the change in the share price, the TSR includes the value of dividends (assuming they were reinvested) and the benefit of any discounted capital raising or spin-off. It's fair to say that the TSR gives a more complete picture for stocks that pay a dividend. As it happens, Mayer Steel Pipe's TSR for the last 5 years was 111%, which exceeds the share price return mentioned earlier. The dividends paid by the company have thusly boosted the total shareholder return.
A Different Perspective
Mayer Steel Pipe shareholders have received returns of 30% over twelve months (even including dividends), which isn't far from the general market return. Most would be happy with a gain, and it helps that the year's return is actually better than the average return over five years, which was 16%. It is possible that management foresight will bring growth well into the future, even if the share price slows down. It's always interesting to track share price performance over the longer term. But to understand Mayer Steel Pipe better, we need to consider many other factors. Take risks, for example - Mayer Steel Pipe has 3 warning signs (and 1 which is a bit concerning) we think you should know about.
For those who like to find winning investments this free list of growing companies with recent insider purchasing, could be just the ticket.
Please note, the market returns quoted in this article reflect the market weighted average returns of stocks that currently trade on TW exchanges.
If you decide to trade Mayer Steel Pipe, use the lowest-cost* platform that is rated #1 Overall by Barron’s, Interactive Brokers. Trade stocks, options, futures, forex, bonds and funds on 135 markets, all from a single integrated account. Promoted
New: Manage All Your Stock Portfolios in One Place
We've created the ultimate portfolio companion for stock investors, and it's free.
• Connect an unlimited number of Portfolios and see your total in one currency
• Be alerted to new Warning Signs or Risks via email or mobile
• Track the Fair Value of your stocks
This article by Simply Wall St is general in nature. It does not constitute a recommendation to buy or sell any stock, and does not take account of your objectives, or your financial situation. We aim to bring you long-term focused analysis driven by fundamental data. Note that our analysis may not factor in the latest price-sensitive company announcements or qualitative material. Simply Wall St has no position in any stocks mentioned.
*Interactive Brokers Rated Lowest Cost Broker by StockBrokers.com Annual Online Review 2020
Have feedback on this article? Concerned about the content? Get in touch with us directly. Alternatively, email editorial-team (at) simplywallst.com.
About TWSE:2020
Mayer Steel Pipe
Processes and sells steel pipes, plates, and other metal products in Taiwan.
Excellent balance sheet second-rate dividend payer.
Market Insights

Advertisement
Community Narratives
MicroStrategy: Volatile Gamble or Golden Opportunity?
Fair Value US$663.00|31.9% undervalued
BL
Community Contributor
Emerging Markets and Debt Reduction Will Propel Bath & Body Works Forward
Fair Value US$40.73|22.1% undervalued
ZW
Community Contributor
An amazing opportunity to potentially get a 100 bagger
Fair Value US$10.00|36.0% overvalued
DA
Community Contributor