Does Evermore Chemical Industry's (TPE:1735) Returns On Capital Reflect Well On The Business?


When researching a stock for investment, what can tell us that the company is in decline? A business that's potentially in decline often shows two trends, a return on capital employed (ROCE) that's declining, and a base of capital employed that's also declining. This combination can tell you that not only is the company investing less, it's earning less on what it does invest. Having said that, after a brief look, Evermore Chemical Industry (TPE:1735) we aren't filled with optimism, but let's investigate further.
Understanding Return On Capital Employed (ROCE)
For those that aren't sure what ROCE is, it measures the amount of pre-tax profits a company can generate from the capital employed in its business. The formula for this calculation on Evermore Chemical Industry is:
Return on Capital Employed = Earnings Before Interest and Tax (EBIT) ÷ (Total Assets - Current Liabilities)
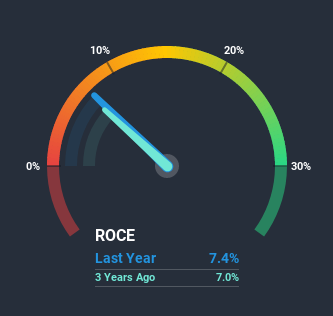
0.074 = NT$114m ÷ (NT$3.0b - NT$1.4b) (Based on the trailing twelve months to September 2020).
So, Evermore Chemical Industry has an ROCE of 7.4%. Even though it's in line with the industry average of 6.7%, it's still a low return by itself.
See our latest analysis for Evermore Chemical Industry
While the past is not representative of the future, it can be helpful to know how a company has performed historically, which is why we have this chart above. If you want to delve into the historical earnings, revenue and cash flow of Evermore Chemical Industry, check out these free graphs here.
What Does the ROCE Trend For Evermore Chemical Industry Tell Us?
In terms of Evermore Chemical Industry's historical ROCE movements, the trend doesn't inspire confidence. About five years ago, returns on capital were 12%, however they're now substantially lower than that as we saw above. Meanwhile, capital employed in the business has stayed roughly the flat over the period. Companies that exhibit these attributes tend to not be shrinking, but they can be mature and facing pressure on their margins from competition. If these trends continue, we wouldn't expect Evermore Chemical Industry to turn into a multi-bagger.
On a side note, Evermore Chemical Industry's current liabilities are still rather high at 48% of total assets. This effectively means that suppliers (or short-term creditors) are funding a large portion of the business, so just be aware that this can introduce some elements of risk. While it's not necessarily a bad thing, it can be beneficial if this ratio is lower.The Key Takeaway
In summary, it's unfortunate that Evermore Chemical Industry is generating lower returns from the same amount of capital. Yet despite these concerning fundamentals, the stock has performed strongly with a 72% return over the last five years, so investors appear very optimistic. Regardless, we don't feel too comfortable with the fundamentals so we'd be steering clear of this stock for now.
If you want to know some of the risks facing Evermore Chemical Industry we've found 5 warning signs (1 is a bit concerning!) that you should be aware of before investing here.
While Evermore Chemical Industry isn't earning the highest return, check out this free list of companies that are earning high returns on equity with solid balance sheets.
When trading Evermore Chemical Industry or any other investment, use the platform considered by many to be the Professional's Gateway to the Worlds Market, Interactive Brokers. You get the lowest-cost* trading on stocks, options, futures, forex, bonds and funds worldwide from a single integrated account. Promoted
Valuation is complex, but we're here to simplify it.
Discover if Evermore Chemical Industry might be undervalued or overvalued with our detailed analysis, featuring fair value estimates, potential risks, dividends, insider trades, and its financial condition.
Access Free AnalysisThis article by Simply Wall St is general in nature. It does not constitute a recommendation to buy or sell any stock, and does not take account of your objectives, or your financial situation. We aim to bring you long-term focused analysis driven by fundamental data. Note that our analysis may not factor in the latest price-sensitive company announcements or qualitative material. Simply Wall St has no position in any stocks mentioned.
*Interactive Brokers Rated Lowest Cost Broker by StockBrokers.com Annual Online Review 2020
Have feedback on this article? Concerned about the content? Get in touch with us directly. Alternatively, email editorial-team@simplywallst.com.
About TWSE:1735
Evermore Chemical Industry
Produces and sells synthetic leather resin in China, Taiwan, and internationally.
Proven track record slight.
Similar Companies
Market Insights

Community Narratives


