
David Iben put it well when he said, 'Volatility is not a risk we care about. What we care about is avoiding the permanent loss of capital.' So it might be obvious that you need to consider debt, when you think about how risky any given stock is, because too much debt can sink a company. We note that Ginar Technology Co.,Ltd. (GTSM:6151) does have debt on its balance sheet. But the more important question is: how much risk is that debt creating?
What Risk Does Debt Bring?
Generally speaking, debt only becomes a real problem when a company can't easily pay it off, either by raising capital or with its own cash flow. In the worst case scenario, a company can go bankrupt if it cannot pay its creditors. However, a more common (but still painful) scenario is that it has to raise new equity capital at a low price, thus permanently diluting shareholders. Of course, debt can be an important tool in businesses, particularly capital heavy businesses. When we examine debt levels, we first consider both cash and debt levels, together.
View our latest analysis for Ginar TechnologyLtd
How Much Debt Does Ginar TechnologyLtd Carry?
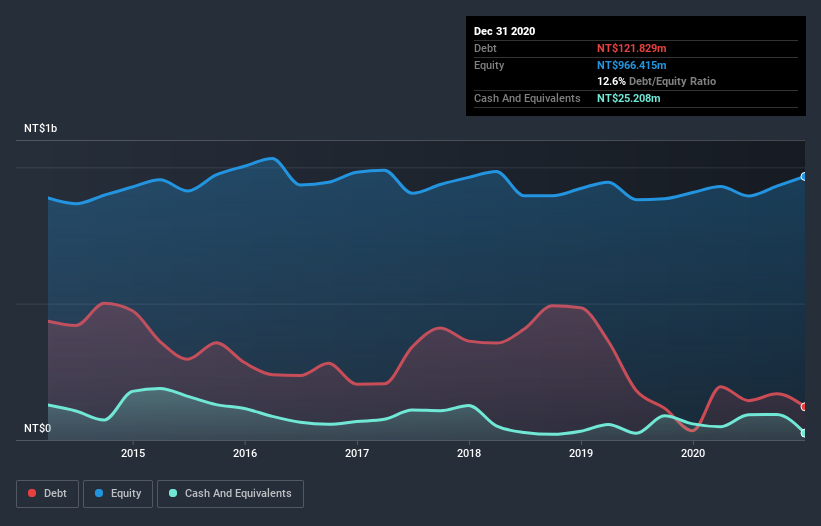
The image below, which you can click on for greater detail, shows that at December 2020 Ginar TechnologyLtd had debt of NT$121.8m, up from NT$34.0m in one year. On the flip side, it has NT$25.2m in cash leading to net debt of about NT$96.6m.
How Strong Is Ginar TechnologyLtd's Balance Sheet?
The latest balance sheet data shows that Ginar TechnologyLtd had liabilities of NT$596.9m due within a year, and liabilities of NT$67.1m falling due after that. On the other hand, it had cash of NT$25.2m and NT$551.3m worth of receivables due within a year. So its liabilities outweigh the sum of its cash and (near-term) receivables by NT$87.5m.
Of course, Ginar TechnologyLtd has a market capitalization of NT$1.99b, so these liabilities are probably manageable. Having said that, it's clear that we should continue to monitor its balance sheet, lest it change for the worse.
We measure a company's debt load relative to its earnings power by looking at its net debt divided by its earnings before interest, tax, depreciation, and amortization (EBITDA) and by calculating how easily its earnings before interest and tax (EBIT) cover its interest expense (interest cover). This way, we consider both the absolute quantum of the debt, as well as the interest rates paid on it.
Ginar TechnologyLtd has a low net debt to EBITDA ratio of only 0.51. And its EBIT easily covers its interest expense, being 248 times the size. So we're pretty relaxed about its super-conservative use of debt. On top of that, Ginar TechnologyLtd grew its EBIT by 65% over the last twelve months, and that growth will make it easier to handle its debt. There's no doubt that we learn most about debt from the balance sheet. But it is Ginar TechnologyLtd's earnings that will influence how the balance sheet holds up in the future. So if you're keen to discover more about its earnings, it might be worth checking out this graph of its long term earnings trend.
Finally, a company can only pay off debt with cold hard cash, not accounting profits. So we clearly need to look at whether that EBIT is leading to corresponding free cash flow. Over the last three years, Ginar TechnologyLtd actually produced more free cash flow than EBIT. There's nothing better than incoming cash when it comes to staying in your lenders' good graces.
Our View
Ginar TechnologyLtd's interest cover suggests it can handle its debt as easily as Cristiano Ronaldo could score a goal against an under 14's goalkeeper. And the good news does not stop there, as its conversion of EBIT to free cash flow also supports that impression! We think Ginar TechnologyLtd is no more beholden to its lenders, than the birds are to birdwatchers. For investing nerds like us its balance sheet is almost charming. There's no doubt that we learn most about debt from the balance sheet. But ultimately, every company can contain risks that exist outside of the balance sheet. These risks can be hard to spot. Every company has them, and we've spotted 4 warning signs for Ginar TechnologyLtd (of which 1 is a bit concerning!) you should know about.
If, after all that, you're more interested in a fast growing company with a rock-solid balance sheet, then check out our list of net cash growth stocks without delay.
If you decide to trade Ginar TechnologyLtd, use the lowest-cost* platform that is rated #1 Overall by Barron’s, Interactive Brokers. Trade stocks, options, futures, forex, bonds and funds on 135 markets, all from a single integrated account. Promoted
The New Payments ETF Is Live on NASDAQ:
Money is moving to real-time rails, and a newly listed ETF now gives investors direct exposure. Fast settlement. Institutional custody. Simple access.
Explore how this launch could reshape portfolios
Sponsored ContentNew: Manage All Your Stock Portfolios in One Place
We've created the ultimate portfolio companion for stock investors, and it's free.
• Connect an unlimited number of Portfolios and see your total in one currency
• Be alerted to new Warning Signs or Risks via email or mobile
• Track the Fair Value of your stocks
This article by Simply Wall St is general in nature. It does not constitute a recommendation to buy or sell any stock, and does not take account of your objectives, or your financial situation. We aim to bring you long-term focused analysis driven by fundamental data. Note that our analysis may not factor in the latest price-sensitive company announcements or qualitative material. Simply Wall St has no position in any stocks mentioned.
*Interactive Brokers Rated Lowest Cost Broker by StockBrokers.com Annual Online Review 2020
Have feedback on this article? Concerned about the content? Get in touch with us directly. Alternatively, email editorial-team (at) simplywallst.com.
About TPEX:6151
Ginar TechnologyLtd
Engages in the research, development, and production of engineering plastic and composite materials in Taiwan and China.
Excellent balance sheet with slight risk.
Similar Companies
Market Insights

Weekly Picks

Early mover in a fast growing industry. Likely to experience share price volatility as they scale


A case for CA$31.80 (undiluted), aka 8,616% upside from CA$0.37 (an 86 bagger!).


Moderation and Stabilisation: HOLD: Fair Price based on a 4-year Cycle is $12.08
Recently Updated Narratives

Airbnb Stock: Platform Growth in a World of Saturation and Scrutiny

Adobe Stock: AI-Fueled ARR Growth Pushes Guidance Higher, But Cost Pressures Loom

Thomson Reuters Stock: When Legal Intelligence Becomes Mission-Critical Infrastructure
Popular Narratives


Crazy Undervalued 42 Baggers Silver Play (Active & Running Mine)


NVDA: Expanding AI Demand Will Drive Major Data Center Investments Through 2026

The AI Infrastructure Giant Grows Into Its Valuation
Trending Discussion


