Advertisement
- Japan
- /
- Consumer Durables
- /
- TSE:6809
Global Dividend Stocks Highlighted By Three Top Performers

Simply Wall St
Reviewed by Simply Wall St

As global markets navigate a landscape marked by easing trade tensions and robust job growth in the U.S., investors have been buoyed by positive earnings reports, leading to gains across major indices like the S&P 500 and Nasdaq Composite. In this environment, dividend stocks stand out as attractive options for those seeking stability and income, offering potential resilience amid economic fluctuations.
Top 10 Dividend Stocks Globally
| Name | Dividend Yield | Dividend Rating |
| Daito Trust ConstructionLtd (TSE:1878) | 4.26% | ★★★★★★ |
| CAC Holdings (TSE:4725) | 4.83% | ★★★★★★ |
| Tsubakimoto Chain (TSE:6371) | 4.53% | ★★★★★★ |
| Nihon Parkerizing (TSE:4095) | 4.14% | ★★★★★★ |
| GakkyushaLtd (TSE:9769) | 4.08% | ★★★★★★ |
| Yamato Kogyo (TSE:5444) | 4.78% | ★★★★★★ |
| E J Holdings (TSE:2153) | 4.98% | ★★★★★★ |
| Soliton Systems K.K (TSE:3040) | 4.11% | ★★★★★★ |
| Japan Excellent (TSE:8987) | 4.44% | ★★★★★★ |
| Banque Cantonale Vaudoise (SWX:BCVN) | 4.37% | ★★★★★★ |
Click here to see the full list of 1553 stocks from our Top Global Dividend Stocks screener.
We'll examine a selection from our screener results.
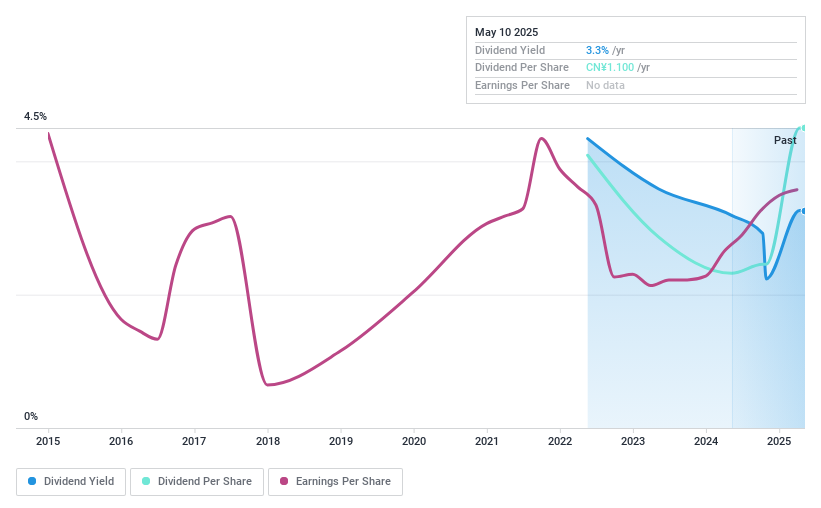
Zhejiang Chinastars New Materials Group (SZSE:301077)
Simply Wall St Dividend Rating: ★★★★☆☆
Overview: Zhejiang Chinastars New Materials Group Co., Ltd. operates in the new materials industry and has a market cap of CN¥3.79 billion.
Operations: Zhejiang Chinastars New Materials Group Co., Ltd. generates its revenue from various segments within the new materials industry.
Dividend Yield: 3.1%
Zhejiang Chinastars New Materials Group's dividend payments have been volatile over its short history, despite recent increases. The company proposed a final cash dividend of CNY 8 per 10 shares for 2024. While dividends are covered by earnings and cash flows with payout ratios of 86.6% and 84.7% respectively, the track record remains unstable. Recent earnings growth of CNY 148.09 million in net income for the full year suggests potential, but share price volatility persists.
- Dive into the specifics of Zhejiang Chinastars New Materials Group here with our thorough dividend report.
- The analysis detailed in our Zhejiang Chinastars New Materials Group valuation report hints at an deflated share price compared to its estimated value.
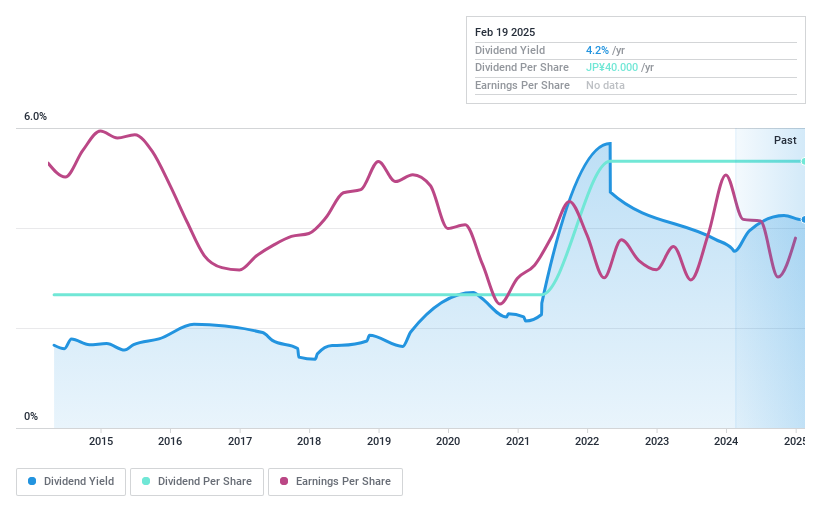
TOA (TSE:6809)
Simply Wall St Dividend Rating: ★★★★★☆
Overview: TOA Corporation manufactures and sells broadcasting, communications, and transmission equipment in Japan with a market cap of ¥28.12 billion.
Operations: TOA Corporation's revenue segments include broadcasting, communications, and transmission equipment.
Dividend Yield: 3.9%
TOA Corporation's dividend strategy reflects stability and coverage, with dividends reliably paid over the past decade. The company announced a ¥20 per share dividend for fiscal 2025 and guidance for the same in fiscal 2026, alongside a special ¥2 dividend. With earnings growth of 18.4% last year and payout ratios indicating coverage by both earnings (70.2%) and cash flows (29.7%), TOA maintains sustainable dividends while trading below its estimated fair value.
- Unlock comprehensive insights into our analysis of TOA stock in this dividend report.
- Our expertly prepared valuation report TOA implies its share price may be lower than expected.
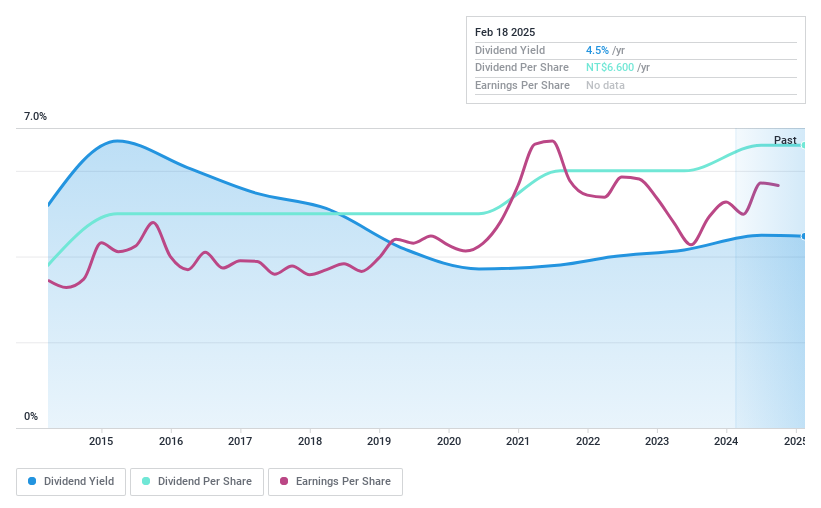
TTET Union (TWSE:1232)
Simply Wall St Dividend Rating: ★★★★★☆
Overview: TTET Union Corporation operates as a soybean crusher in Taiwan, Malaysia, Japan, and internationally with a market cap of NT$25.84 billion.
Operations: TTET Union Corporation generates revenue from its operations as a soybean crusher across various regions, including Taiwan, Malaysia, and Japan.
Dividend Yield: 4.3%
TTET Union Corporation's dividend strategy is underpinned by a payout ratio of 83.3%, indicating dividends are covered by both earnings and cash flows. Despite a decrease in sales for Q1 2025 to TWD 5.40 billion, net income rose to TWD 308.56 million, supporting stable dividend payments over the past decade. While its yield of 4.29% is below the top tier in Taiwan, consistent growth and reliability make it an attractive option for income-focused investors.
- Navigate through the intricacies of TTET Union with our comprehensive dividend report here.
- In light of our recent valuation report, it seems possible that TTET Union is trading beyond its estimated value.
Taking Advantage
- Click through to start exploring the rest of the 1550 Top Global Dividend Stocks now.
- Invested in any of these stocks? Simplify your portfolio management with Simply Wall St and stay ahead with our alerts for any critical updates on your stocks.
- Join a community of smart investors by using Simply Wall St. It's free and delivers expert-level analysis on worldwide markets.
Searching for a Fresh Perspective?
- Explore high-performing small cap companies that haven't yet garnered significant analyst attention.
- Fuel your portfolio with companies showing strong growth potential, backed by optimistic outlooks both from analysts and management.
- Find companies with promising cash flow potential yet trading below their fair value.
This article by Simply Wall St is general in nature. We provide commentary based on historical data and analyst forecasts only using an unbiased methodology and our articles are not intended to be financial advice. It does not constitute a recommendation to buy or sell any stock, and does not take account of your objectives, or your financial situation. We aim to bring you long-term focused analysis driven by fundamental data. Note that our analysis may not factor in the latest price-sensitive company announcements or qualitative material. Simply Wall St has no position in any stocks mentioned.
Valuation is complex, but we're here to simplify it.
Discover if TOA might be undervalued or overvalued with our detailed analysis, featuring fair value estimates, potential risks, dividends, insider trades, and its financial condition.
Access Free AnalysisHave feedback on this article? Concerned about the content? Get in touch with us directly. Alternatively, email editorial-team@simplywallst.com
About TSE:6809
TOA
Manufactures and sells broadcasting, communications, and transmission equipment in Japan.
Flawless balance sheet 6 star dividend payer.
Similar Companies
Market Insights


Advertisement
Community Narratives
The Future of Drug Testing? Fingerprint Tech Shows Serious Promise
Fair Value US$2.98|43.0% undervalued
JO
Community Contributor
Suncorp’s Next Chapter: Insurance-Only and Ready to Grow
Fair Value AU$22.83|7.6% undervalued
RO
Community Contributor
Thyssenkrupp Nucera Will Achieve Double-Digit Profits by 2030 Boosted by Hydrogen Growth
Fair Value €14.40|30.6% undervalued
CH
Community Contributor
Tesla’s Nvidia Moment – The AI & Robotics Inflection Point
Fair Value US$359.72|18.3% undervalued
BL
Community Contributor