
Advertisement
Ve Wong Corporation's (TPE:1203) Stock Been Rising: Are Strong Financials Guiding The Market?
Most readers would already know that Ve Wong's (TPE:1203) stock increased by 3.4% over the past month. Given that the market rewards strong financials in the long-term, we wonder if that is the case in this instance. Specifically, we decided to study Ve Wong's ROE in this article.
ROE or return on equity is a useful tool to assess how effectively a company can generate returns on the investment it received from its shareholders. In simpler terms, it measures the profitability of a company in relation to shareholder's equity.
Check out our latest analysis for Ve Wong
How To Calculate Return On Equity?
The formula for ROE is:
Return on Equity = Net Profit (from continuing operations) ÷ Shareholders' Equity
So, based on the above formula, the ROE for Ve Wong is:
12% = NT$748m ÷ NT$6.1b (Based on the trailing twelve months to September 2020).
The 'return' refers to a company's earnings over the last year. Another way to think of that is that for every NT$1 worth of equity, the company was able to earn NT$0.12 in profit.
Why Is ROE Important For Earnings Growth?
So far, we've learned that ROE is a measure of a company's profitability. We now need to evaluate how much profit the company reinvests or "retains" for future growth which then gives us an idea about the growth potential of the company. Generally speaking, other things being equal, firms with a high return on equity and profit retention, have a higher growth rate than firms that don’t share these attributes.
Ve Wong's Earnings Growth And 12% ROE
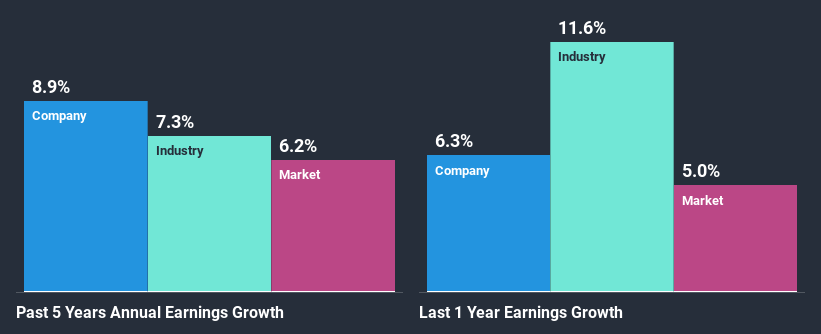
To start with, Ve Wong's ROE looks acceptable. And on comparing with the industry, we found that the the average industry ROE is similar at 11%. This probably goes some way in explaining Ve Wong's moderate 8.9% growth over the past five years amongst other factors.
As a next step, we compared Ve Wong's net income growth with the industry, and pleasingly, we found that the growth seen by the company is higher than the average industry growth of 7.3%.
The basis for attaching value to a company is, to a great extent, tied to its earnings growth. The investor should try to establish if the expected growth or decline in earnings, whichever the case may be, is priced in. By doing so, they will have an idea if the stock is headed into clear blue waters or if swampy waters await. Is 1203 fairly valued? This infographic on the company's intrinsic value has everything you need to know.
Is Ve Wong Efficiently Re-investing Its Profits?
While Ve Wong has a three-year median payout ratio of 54% (which means it retains 46% of profits), the company has still seen a fair bit of earnings growth in the past, meaning that its high payout ratio hasn't hampered its ability to grow.
Moreover, Ve Wong is determined to keep sharing its profits with shareholders which we infer from its long history of paying a dividend for at least ten years.
Conclusion
In total, we are pretty happy with Ve Wong's performance. We are particularly impressed by the considerable earnings growth posted by the company, which was likely backed by its high ROE. While the company is paying out most of its earnings as dividends, it has been able to grow its earnings in spite of it, so that's probably a good sign. Up till now, we've only made a short study of the company's growth data. So it may be worth checking this free detailed graph of Ve Wong's past earnings, as well as revenue and cash flows to get a deeper insight into the company's performance.
If you decide to trade Ve Wong, use the lowest-cost* platform that is rated #1 Overall by Barron’s, Interactive Brokers. Trade stocks, options, futures, forex, bonds and funds on 135 markets, all from a single integrated account. Promoted
New: Manage All Your Stock Portfolios in One Place
We've created the ultimate portfolio companion for stock investors, and it's free.
• Connect an unlimited number of Portfolios and see your total in one currency
• Be alerted to new Warning Signs or Risks via email or mobile
• Track the Fair Value of your stocks
This article by Simply Wall St is general in nature. It does not constitute a recommendation to buy or sell any stock, and does not take account of your objectives, or your financial situation. We aim to bring you long-term focused analysis driven by fundamental data. Note that our analysis may not factor in the latest price-sensitive company announcements or qualitative material. Simply Wall St has no position in any stocks mentioned.
*Interactive Brokers Rated Lowest Cost Broker by StockBrokers.com Annual Online Review 2020
Have feedback on this article? Concerned about the content? Get in touch with us directly. Alternatively, email editorial-team (at) simplywallst.com.
About TWSE:1203
Ve Wong
Produces and distributes foods, drinks, and seasonings in Taiwan, Thailand, and Vietnam.
Excellent balance sheet established dividend payer.
Similar Companies
Market Insights

Advertisement
Community Narratives
Finding The True Value Of A Logistics Powerhouse
Fair Value US$95.21|8.7% undervalued
NV
Community Contributor
Paradigm Biopharmaceuticals Will Lead Osteoarthritis Treatment with Zilosul's FDA Success
Fair Value AU$5.50|93.3% undervalued
AM
Community Contributor
Barrick Mining (ABX:CA): A Gold Hedge against a U.S. Shutdown
Fair Value CA$60.00|18.7% undervalued
GM
Community Contributor