
Advertisement
In this article we are going to estimate the intrinsic value of Kino Co., Ltd. (GTSM:4154) by taking the forecast future cash flows of the company and discounting them back to today's value. The Discounted Cash Flow (DCF) model is the tool we will apply to do this. Before you think you won't be able to understand it, just read on! It's actually much less complex than you'd imagine.
Companies can be valued in a lot of ways, so we would point out that a DCF is not perfect for every situation. If you still have some burning questions about this type of valuation, take a look at the Simply Wall St analysis model.
Check out our latest analysis for Kino
Crunching the numbers
We're using the 2-stage growth model, which simply means we take in account two stages of company's growth. In the initial period the company may have a higher growth rate and the second stage is usually assumed to have a stable growth rate. To start off with, we need to estimate the next ten years of cash flows. Seeing as no analyst estimates of free cash flow are available to us, we have extrapolate the previous free cash flow (FCF) from the company's last reported value. We assume companies with shrinking free cash flow will slow their rate of shrinkage, and that companies with growing free cash flow will see their growth rate slow, over this period. We do this to reflect that growth tends to slow more in the early years than it does in later years.
Generally we assume that a dollar today is more valuable than a dollar in the future, so we need to discount the sum of these future cash flows to arrive at a present value estimate:
10-year free cash flow (FCF) forecast
| 2021 | 2022 | 2023 | 2024 | 2025 | 2026 | 2027 | 2028 | 2029 | 2030 | |
| Levered FCF (NT$, Millions) | NT$10.4m | NT$16.1m | NT$22.2m | NT$28.2m | NT$33.7m | NT$38.3m | NT$42.1m | NT$45.1m | NT$47.5m | NT$49.4m |
| Growth Rate Estimate Source | Est @ 77.05% | Est @ 54.22% | Est @ 38.24% | Est @ 27.05% | Est @ 19.22% | Est @ 13.73% | Est @ 9.89% | Est @ 7.21% | Est @ 5.33% | Est @ 4.01% |
| Present Value (NT$, Millions) Discounted @ 5.7% | NT$9.9 | NT$14.4 | NT$18.8 | NT$22.6 | NT$25.5 | NT$27.4 | NT$28.5 | NT$28.9 | NT$28.7 | NT$28.3 |
("Est" = FCF growth rate estimated by Simply Wall St)
Present Value of 10-year Cash Flow (PVCF) = NT$232m
The second stage is also known as Terminal Value, this is the business's cash flow after the first stage. The Gordon Growth formula is used to calculate Terminal Value at a future annual growth rate equal to the 5-year average of the 10-year government bond yield of 0.9%. We discount the terminal cash flows to today's value at a cost of equity of 5.7%.
Terminal Value (TV)= FCF2030 × (1 + g) ÷ (r – g) = NT$49m× (1 + 0.9%) ÷ (5.7%– 0.9%) = NT$1.0b
Present Value of Terminal Value (PVTV)= TV / (1 + r)10= NT$1.0b÷ ( 1 + 5.7%)10= NT$593m
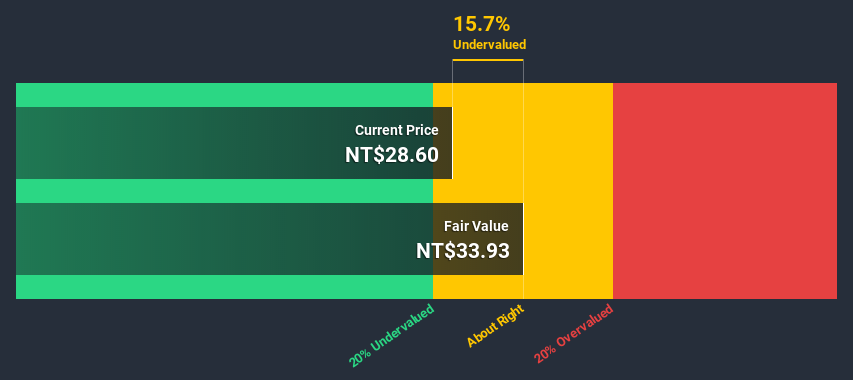
The total value, or equity value, is then the sum of the present value of the future cash flows, which in this case is NT$825m. The last step is to then divide the equity value by the number of shares outstanding. Compared to the current share price of NT$28.6, the company appears about fair value at a 16% discount to where the stock price trades currently. Remember though, that this is just an approximate valuation, and like any complex formula - garbage in, garbage out.
Important assumptions
Now the most important inputs to a discounted cash flow are the discount rate, and of course, the actual cash flows. If you don't agree with these result, have a go at the calculation yourself and play with the assumptions. The DCF also does not consider the possible cyclicality of an industry, or a company's future capital requirements, so it does not give a full picture of a company's potential performance. Given that we are looking at Kino as potential shareholders, the cost of equity is used as the discount rate, rather than the cost of capital (or weighted average cost of capital, WACC) which accounts for debt. In this calculation we've used 5.7%, which is based on a levered beta of 0.800. Beta is a measure of a stock's volatility, compared to the market as a whole. We get our beta from the industry average beta of globally comparable companies, with an imposed limit between 0.8 and 2.0, which is a reasonable range for a stable business.
Moving On:
Although the valuation of a company is important, it ideally won't be the sole piece of analysis you scrutinize for a company. The DCF model is not a perfect stock valuation tool. Rather it should be seen as a guide to "what assumptions need to be true for this stock to be under/overvalued?" If a company grows at a different rate, or if its cost of equity or risk free rate changes sharply, the output can look very different. For Kino, we've compiled three relevant items you should assess:
- Risks: As an example, we've found 2 warning signs for Kino (1 is a bit unpleasant!) that you need to consider before investing here.
- Other High Quality Alternatives: Do you like a good all-rounder? Explore our interactive list of high quality stocks to get an idea of what else is out there you may be missing!
- Other Top Analyst Picks: Interested to see what the analysts are thinking? Take a look at our interactive list of analysts' top stock picks to find out what they feel might have an attractive future outlook!
PS. Simply Wall St updates its DCF calculation for every Taiwanese stock every day, so if you want to find the intrinsic value of any other stock just search here.
If you decide to trade Kino, use the lowest-cost* platform that is rated #1 Overall by Barron’s, Interactive Brokers. Trade stocks, options, futures, forex, bonds and funds on 135 markets, all from a single integrated account. Promoted
New: AI Stock Screener & Alerts
Our new AI Stock Screener scans the market every day to uncover opportunities.
• Dividend Powerhouses (3%+ Yield)
• Undervalued Small Caps with Insider Buying
• High growth Tech and AI Companies
Or build your own from over 50 metrics.
This article by Simply Wall St is general in nature. It does not constitute a recommendation to buy or sell any stock, and does not take account of your objectives, or your financial situation. We aim to bring you long-term focused analysis driven by fundamental data. Note that our analysis may not factor in the latest price-sensitive company announcements or qualitative material. Simply Wall St has no position in any stocks mentioned.
*Interactive Brokers Rated Lowest Cost Broker by StockBrokers.com Annual Online Review 2020
Have feedback on this article? Concerned about the content? Get in touch with us directly. Alternatively, email editorial-team@simplywallst.com.
About TPEX:4154
Raku
Raku Co., Ltd manufacturing and trading of accessories in Malaysia, China, Taiwan, Thailand, and internationally.
Flawless balance sheet with low risk.
Market Insights

Advertisement
Community Narratives
MicroVision will explode future revenue by 380.37% with a vision towards success
Fair Value US$60|98.4% undervalued
TH
Community Contributor
The Indispensable Artery for a New North American Economy
Fair Value CA$132.87|0.6% undervalued
TI
Community Contributor
Recently Updated Narratives
BL


BlackGoat on Alphabet ·
Alphabet: The Under-appreciated Compounder Hiding in Plain Sight
Fair Value:US$324.481.3% undervalued
74 followersusers have followed this narrative
3 commentsusers have commented on this narrative
1 likeusers have liked this narrative
BE


Bejgal on MINISO Group Holding ·
MINISO's fair value is projected at 26.69 with an anticipated PE ratio shift of 20x
Fair Value:US$26.6926.7% undervalued
44 followersusers have followed this narrative
3 commentsusers have commented on this narrative
0 likesusers have liked this narrative
TI


TickerTickle on Oracle ·
The Quiet Giant That Became AI’s Power Grid
Fair Value:US$389.8147.4% undervalued
9 followersusers have followed this narrative
1 commentusers have commented on this narrative
0 likesusers have liked this narrative
Popular Narratives
OS

oscargarcia on Alphabet ·
The company that turned a verb into a global necessity and basically runs the modern internet, digital ads, smartphones, maps, and AI.
Fair Value:US$3405.9% undervalued
136 followersusers have followed this narrative
6 commentsusers have commented on this narrative
18 likesusers have liked this narrative
TH

TheWallstreetKing on MicroVision ·
MicroVision will explode future revenue by 380.37% with a vision towards success
Fair Value:US$6098.4% undervalued
89 followersusers have followed this narrative
11 commentsusers have commented on this narrative
18 likesusers have liked this narrative
AN


AnalystConsensusTarget on NVIDIA ·
NVDA: Expanding AI Demand Will Drive Major Data Center Investments Through 2026
Fair Value:US$232.7922.6% undervalued
926 followersusers have followed this narrative
6 commentsusers have commented on this narrative
22 likesusers have liked this narrative