
Advertisement
Are Johnson Health Tech .Co., Ltd. (TWSE:1736) Investors Paying Above The Intrinsic Value?

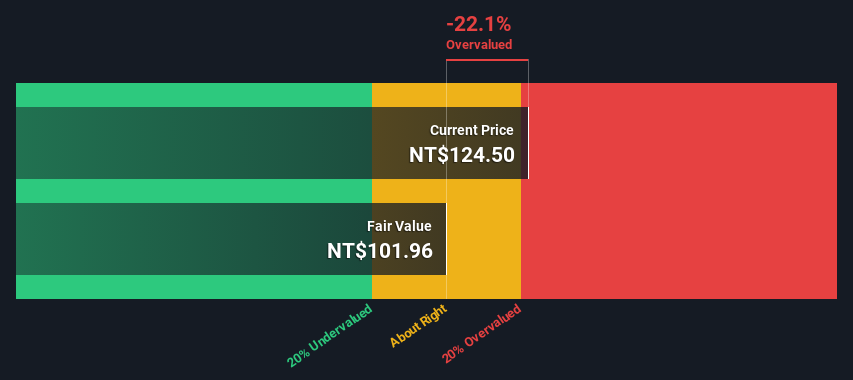
Key Insights
- The projected fair value for Johnson Health Tech .Co is NT$102 based on 2 Stage Free Cash Flow to Equity
- Johnson Health Tech .Co is estimated to be 22% overvalued based on current share price of NT$125
- When compared to theindustry average discount of -332%, Johnson Health Tech .Co's competitors seem to be trading at a greater premium to fair value
In this article we are going to estimate the intrinsic value of Johnson Health Tech .Co., Ltd. (TWSE:1736) by taking the forecast future cash flows of the company and discounting them back to today's value. We will use the Discounted Cash Flow (DCF) model on this occasion. Models like these may appear beyond the comprehension of a lay person, but they're fairly easy to follow.
We generally believe that a company's value is the present value of all of the cash it will generate in the future. However, a DCF is just one valuation metric among many, and it is not without flaws. If you still have some burning questions about this type of valuation, take a look at the Simply Wall St analysis model.
Check out our latest analysis for Johnson Health Tech .Co
The Method
We are going to use a two-stage DCF model, which, as the name states, takes into account two stages of growth. The first stage is generally a higher growth period which levels off heading towards the terminal value, captured in the second 'steady growth' period. To begin with, we have to get estimates of the next ten years of cash flows. Where possible we use analyst estimates, but when these aren't available we extrapolate the previous free cash flow (FCF) from the last estimate or reported value. We assume companies with shrinking free cash flow will slow their rate of shrinkage, and that companies with growing free cash flow will see their growth rate slow, over this period. We do this to reflect that growth tends to slow more in the early years than it does in later years.
A DCF is all about the idea that a dollar in the future is less valuable than a dollar today, and so the sum of these future cash flows is then discounted to today's value:
10-year free cash flow (FCF) estimate
| 2025 | 2026 | 2027 | 2028 | 2029 | 2030 | 2031 | 2032 | 2033 | 2034 | |
| Levered FCF (NT$, Millions) | NT$2.36b | NT$2.16b | NT$2.04b | NT$1.97b | NT$1.93b | NT$1.90b | NT$1.89b | NT$1.89b | NT$1.89b | NT$1.90b |
| Growth Rate Estimate Source | Analyst x1 | Est @ -8.44% | Est @ -5.60% | Est @ -3.61% | Est @ -2.22% | Est @ -1.25% | Est @ -0.57% | Est @ -0.09% | Est @ 0.24% | Est @ 0.47% |
| Present Value (NT$, Millions) Discounted @ 6.9% | NT$2.2k | NT$1.9k | NT$1.7k | NT$1.5k | NT$1.4k | NT$1.3k | NT$1.2k | NT$1.1k | NT$1.0k | NT$974 |
("Est" = FCF growth rate estimated by Simply Wall St)
Present Value of 10-year Cash Flow (PVCF) = NT$14b
The second stage is also known as Terminal Value, this is the business's cash flow after the first stage. For a number of reasons a very conservative growth rate is used that cannot exceed that of a country's GDP growth. In this case we have used the 5-year average of the 10-year government bond yield (1.0%) to estimate future growth. In the same way as with the 10-year 'growth' period, we discount future cash flows to today's value, using a cost of equity of 6.9%.
Terminal Value (TV)= FCF2034 × (1 + g) ÷ (r – g) = NT$1.9b× (1 + 1.0%) ÷ (6.9%– 1.0%) = NT$33b
Present Value of Terminal Value (PVTV)= TV / (1 + r)10= NT$33b÷ ( 1 + 6.9%)10= NT$17b
The total value, or equity value, is then the sum of the present value of the future cash flows, which in this case is NT$31b. To get the intrinsic value per share, we divide this by the total number of shares outstanding. Relative to the current share price of NT$125, the company appears slightly overvalued at the time of writing. Valuations are imprecise instruments though, rather like a telescope - move a few degrees and end up in a different galaxy. Do keep this in mind.
Important Assumptions
The calculation above is very dependent on two assumptions. The first is the discount rate and the other is the cash flows. You don't have to agree with these inputs, I recommend redoing the calculations yourself and playing with them. The DCF also does not consider the possible cyclicality of an industry, or a company's future capital requirements, so it does not give a full picture of a company's potential performance. Given that we are looking at Johnson Health Tech .Co as potential shareholders, the cost of equity is used as the discount rate, rather than the cost of capital (or weighted average cost of capital, WACC) which accounts for debt. In this calculation we've used 6.9%, which is based on a levered beta of 1.218. Beta is a measure of a stock's volatility, compared to the market as a whole. We get our beta from the industry average beta of globally comparable companies, with an imposed limit between 0.8 and 2.0, which is a reasonable range for a stable business.
SWOT Analysis for Johnson Health Tech .Co
Strength
- Earnings growth over the past year exceeded the industry.
- Debt is well covered by earnings and cashflows.
Weakness
- Dividend is low compared to the top 25% of dividend payers in the Leisure market.
- Expensive based on P/E ratio and estimated fair value.
Opportunity
- Annual earnings are forecast to grow faster than the Taiwanese market.
Threat
- No apparent threats visible for 1736.
Moving On:
Although the valuation of a company is important, it ideally won't be the sole piece of analysis you scrutinize for a company. It's not possible to obtain a foolproof valuation with a DCF model. Rather it should be seen as a guide to "what assumptions need to be true for this stock to be under/overvalued?" For instance, if the terminal value growth rate is adjusted slightly, it can dramatically alter the overall result. What is the reason for the share price exceeding the intrinsic value? For Johnson Health Tech .Co, there are three relevant items you should further examine:
- Risks: Be aware that Johnson Health Tech .Co is showing 2 warning signs in our investment analysis , you should know about...
- Future Earnings: How does 1736's growth rate compare to its peers and the wider market? Dig deeper into the analyst consensus number for the upcoming years by interacting with our free analyst growth expectation chart.
- Other High Quality Alternatives: Do you like a good all-rounder? Explore our interactive list of high quality stocks to get an idea of what else is out there you may be missing!
PS. Simply Wall St updates its DCF calculation for every Taiwanese stock every day, so if you want to find the intrinsic value of any other stock just search here.
New: Manage All Your Stock Portfolios in One Place
We've created the ultimate portfolio companion for stock investors, and it's free.
• Connect an unlimited number of Portfolios and see your total in one currency
• Be alerted to new Warning Signs or Risks via email or mobile
• Track the Fair Value of your stocks
Have feedback on this article? Concerned about the content? Get in touch with us directly. Alternatively, email editorial-team (at) simplywallst.com.
This article by Simply Wall St is general in nature. We provide commentary based on historical data and analyst forecasts only using an unbiased methodology and our articles are not intended to be financial advice. It does not constitute a recommendation to buy or sell any stock, and does not take account of your objectives, or your financial situation. We aim to bring you long-term focused analysis driven by fundamental data. Note that our analysis may not factor in the latest price-sensitive company announcements or qualitative material. Simply Wall St has no position in any stocks mentioned.
About TWSE:1736
Johnson Health Tech .Co
Johnson Health Tech. Co., Ltd. engages in the manufacture and sale of sports and fitness equipment in the Americas, Europe, Asia, and internationally.
Solid track record with mediocre balance sheet.
Similar Companies
Market Insights

Advertisement
Community Narratives

BMW cruising ahead with new EVs and premium models to boost revenue 5%
Fair Value €135.07|43.5% undervalued
UN
Community Contributor
EU#2 - From Humble Beginnings to Global Powerhouse
Fair Value DKK 851.04|51.3% undervalued
TO
Community Contributor