
Advertisement
What Ying Han Technology Co., Ltd.'s (TWSE:4562) 31% Share Price Gain Is Not Telling You

Despite an already strong run, Ying Han Technology Co., Ltd. (TWSE:4562) shares have been powering on, with a gain of 31% in the last thirty days. The last month tops off a massive increase of 288% in the last year.
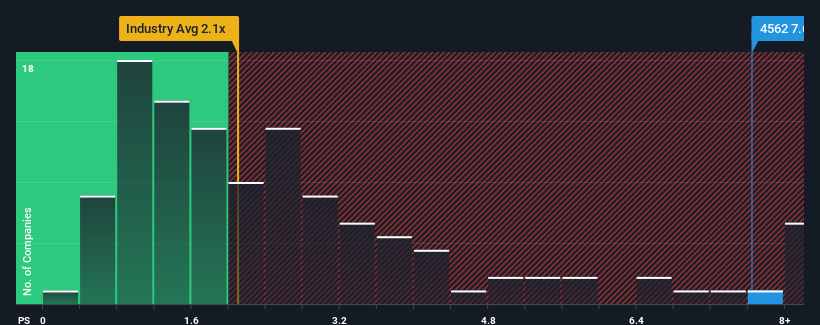
After such a large jump in price, you could be forgiven for thinking Ying Han Technology is a stock to steer clear of with a price-to-sales ratios (or "P/S") of 7.6x, considering almost half the companies in Taiwan's Machinery industry have P/S ratios below 2.1x. However, the P/S might be quite high for a reason and it requires further investigation to determine if it's justified.
View our latest analysis for Ying Han Technology
What Does Ying Han Technology's P/S Mean For Shareholders?
For instance, Ying Han Technology's receding revenue in recent times would have to be some food for thought. Perhaps the market believes the company can do enough to outperform the rest of the industry in the near future, which is keeping the P/S ratio high. You'd really hope so, otherwise you're paying a pretty hefty price for no particular reason.
Want the full picture on earnings, revenue and cash flow for the company? Then our free report on Ying Han Technology will help you shine a light on its historical performance.Is There Enough Revenue Growth Forecasted For Ying Han Technology?
Ying Han Technology's P/S ratio would be typical for a company that's expected to deliver very strong growth, and importantly, perform much better than the industry.
Taking a look back first, the company's revenue growth last year wasn't something to get excited about as it posted a disappointing decline of 7.9%. This has soured the latest three-year period, which nevertheless managed to deliver a decent 5.7% overall rise in revenue. Accordingly, while they would have preferred to keep the run going, shareholders would be roughly satisfied with the medium-term rates of revenue growth.
This is in contrast to the rest of the industry, which is expected to grow by 18% over the next year, materially higher than the company's recent medium-term annualised growth rates.
In light of this, it's alarming that Ying Han Technology's P/S sits above the majority of other companies. It seems most investors are ignoring the fairly limited recent growth rates and are hoping for a turnaround in the company's business prospects. There's a good chance existing shareholders are setting themselves up for future disappointment if the P/S falls to levels more in line with recent growth rates.
The Final Word
Ying Han Technology's P/S has grown nicely over the last month thanks to a handy boost in the share price. While the price-to-sales ratio shouldn't be the defining factor in whether you buy a stock or not, it's quite a capable barometer of revenue expectations.
The fact that Ying Han Technology currently trades on a higher P/S relative to the industry is an oddity, since its recent three-year growth is lower than the wider industry forecast. When we see slower than industry revenue growth but an elevated P/S, there's considerable risk of the share price declining, sending the P/S lower. If recent medium-term revenue trends continue, it will place shareholders' investments at significant risk and potential investors in danger of paying an excessive premium.
It's always necessary to consider the ever-present spectre of investment risk. We've identified 3 warning signs with Ying Han Technology, and understanding them should be part of your investment process.
If these risks are making you reconsider your opinion on Ying Han Technology, explore our interactive list of high quality stocks to get an idea of what else is out there.
New: Manage All Your Stock Portfolios in One Place
We've created the ultimate portfolio companion for stock investors, and it's free.
• Connect an unlimited number of Portfolios and see your total in one currency
• Be alerted to new Warning Signs or Risks via email or mobile
• Track the Fair Value of your stocks
Have feedback on this article? Concerned about the content? Get in touch with us directly. Alternatively, email editorial-team (at) simplywallst.com.
This article by Simply Wall St is general in nature. We provide commentary based on historical data and analyst forecasts only using an unbiased methodology and our articles are not intended to be financial advice. It does not constitute a recommendation to buy or sell any stock, and does not take account of your objectives, or your financial situation. We aim to bring you long-term focused analysis driven by fundamental data. Note that our analysis may not factor in the latest price-sensitive company announcements or qualitative material. Simply Wall St has no position in any stocks mentioned.
Have feedback on this article? Concerned about the content? Get in touch with us directly. Alternatively, email editorial-team@simplywallst.com
About TWSE:4562
Ying Han Technology
Manufactures, supplies, and sells tube and pipe bending machinery in Taiwan and internationally.
Mediocre balance sheet very low.
Similar Companies
Market Insights

Advertisement
Community Narratives
MicroStrategy: Volatile Gamble or Golden Opportunity?
Fair Value US$663.00|36.2% undervalued
BL
Community Contributor
Emerging Markets and Debt Reduction Will Propel Bath & Body Works Forward
Fair Value US$40.73|22.0% undervalued
ZW
Community Contributor
An amazing opportunity to potentially get a 100 bagger
Fair Value US$10.00|46.4% overvalued
DA
Community Contributor