
Advertisement
- Taiwan
- /
- Electrical
- /
- TWSE:3501
Are Dividend Investors Getting More Than They Bargained For With Well Shin Technology Co., Ltd.'s (TPE:3501) Dividend?

Could Well Shin Technology Co., Ltd. (TPE:3501) be an attractive dividend share to own for the long haul? Investors are often drawn to strong companies with the idea of reinvesting the dividends. If you are hoping to live on the income from dividends, it's important to be a lot more stringent with your investments than the average punter.
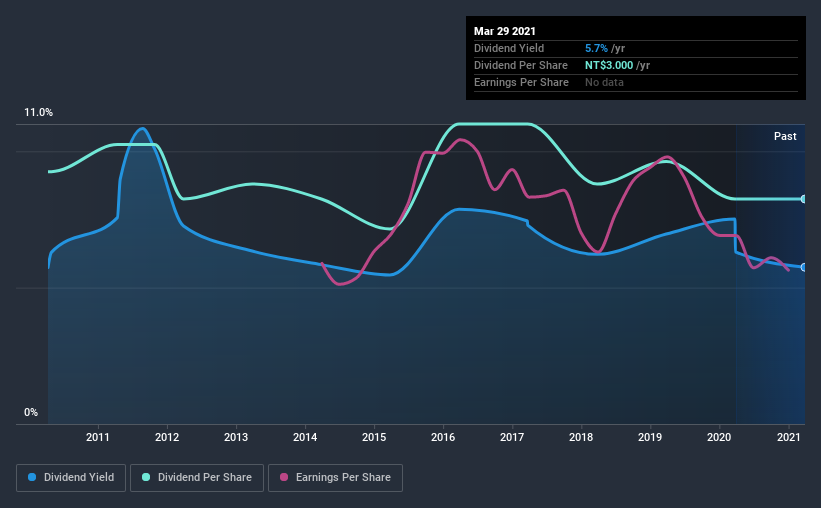
In this case, Well Shin Technology likely looks attractive to investors, given its 5.7% dividend yield and a payment history of over ten years. It would not be a surprise to discover that many investors buy it for the dividends. Some simple analysis can reduce the risk of holding Well Shin Technology for its dividend, and we'll focus on the most important aspects below.
Explore this interactive chart for our latest analysis on Well Shin Technology!
Payout ratios
Companies (usually) pay dividends out of their earnings. If a company is paying more than it earns, the dividend might have to be cut. As a result, we should always investigate whether a company can afford its dividend, measured as a percentage of a company's net income after tax. Looking at the data, we can see that 84% of Well Shin Technology's profits were paid out as dividends in the last 12 months. It's paying out most of its earnings, which limits the amount that can be reinvested in the business. This may indicate limited need for further capital within the business, or highlight a commitment to paying a dividend.
We also measure dividends paid against a company's levered free cash flow, to see if enough cash was generated to cover the dividend. Well Shin Technology paid out 292% of its free cash last year. Cash flows can be lumpy, but this dividend was not well covered by cash flow. Paying out such a high percentage of cash flow suggests that the dividend was funded from either cash at bank or by borrowing, neither of which is desirable over the long term. Well Shin Technology paid out less in dividends than it reported in profits, but unfortunately it didn't generate enough free cash flow to cover the dividend. Were it to repeatedly pay dividends that were not well covered by cash flow, this could be a risk to Well Shin Technology's ability to maintain its dividend.
With a strong net cash balance, Well Shin Technology investors may not have much to worry about in the near term from a dividend perspective.
Remember, you can always get a snapshot of Well Shin Technology's latest financial position, by checking our visualisation of its financial health.
Dividend Volatility
Before buying a stock for its income, we want to see if the dividends have been stable in the past, and if the company has a track record of maintaining its dividend. For the purpose of this article, we only scrutinise the last decade of Well Shin Technology's dividend payments. The dividend has been cut on at least one occasion historically. During the past 10-year period, the first annual payment was NT$3.4 in 2011, compared to NT$3.0 last year. The dividend has shrunk at around 1.1% a year during that period. Well Shin Technology's dividend has been cut sharply at least once, so it hasn't fallen by 1.1% every year, but this is a decent approximation of the long term change.
When a company's per-share dividend falls we question if this reflects poorly on either external business conditions, or the company's capital allocation decisions. Either way, we find it hard to get excited about a company with a declining dividend.
Dividend Growth Potential
Given that the dividend has been cut in the past, we need to check if earnings are growing and if that might lead to stronger dividends in the future. Well Shin Technology's earnings per share have shrunk at 11% a year over the past five years. A sharp decline in earnings per share is not great from from a dividend perspective, as even conservative payout ratios can come under pressure if earnings fall far enough.
Conclusion
To summarise, shareholders should always check that Well Shin Technology's dividends are affordable, that its dividend payments are relatively stable, and that it has decent prospects for growing its earnings and dividend. Well Shin Technology gets a pass on its dividend payout ratio, but it paid out virtually all of its cash flow as dividends. This may just be a one-off, but we'd keep an eye on this. Second, earnings per share have been in decline, and its dividend has been cut at least once in the past. In this analysis, Well Shin Technology doesn't shape up too well as a dividend stock. We'd find it hard to look past the flaws, and would not be inclined to think of it as a reliable dividend-payer.
Investors generally tend to favour companies with a consistent, stable dividend policy as opposed to those operating an irregular one. At the same time, there are other factors our readers should be conscious of before pouring capital into a stock. Case in point: We've spotted 2 warning signs for Well Shin Technology (of which 1 is potentially serious!) you should know about.
Looking for more high-yielding dividend ideas? Try our curated list of dividend stocks with a yield above 3%.
If you decide to trade Well Shin Technology, use the lowest-cost* platform that is rated #1 Overall by Barron’s, Interactive Brokers. Trade stocks, options, futures, forex, bonds and funds on 135 markets, all from a single integrated account. Promoted
Valuation is complex, but we're here to simplify it.
Discover if Well Shin Technology might be undervalued or overvalued with our detailed analysis, featuring fair value estimates, potential risks, dividends, insider trades, and its financial condition.
Access Free AnalysisThis article by Simply Wall St is general in nature. It does not constitute a recommendation to buy or sell any stock, and does not take account of your objectives, or your financial situation. We aim to bring you long-term focused analysis driven by fundamental data. Note that our analysis may not factor in the latest price-sensitive company announcements or qualitative material. Simply Wall St has no position in any stocks mentioned.
*Interactive Brokers Rated Lowest Cost Broker by StockBrokers.com Annual Online Review 2020
Have feedback on this article? Concerned about the content? Get in touch with us directly. Alternatively, email editorial-team (at) simplywallst.com.
About TWSE:3501
Well Shin Technology
Engages in the manufacture, wholesale, and retail of wire and cable products, electronic components, and electronic materials in Asia, the United States, Europe, and internationally.
Flawless balance sheet with proven track record and pays a dividend.
Market Insights


Advertisement
Community Narratives
The Future of Drug Testing? Fingerprint Tech Shows Serious Promise
Fair Value US$2.98|40.3% undervalued
JO
Community Contributor
Suncorp’s Next Chapter: Insurance-Only and Ready to Grow
Fair Value AU$22.83|7.9% undervalued
RO
Community Contributor
Thyssenkrupp Nucera Will Achieve Double-Digit Profits by 2030 Boosted by Hydrogen Growth
Fair Value €14.40|31.6% undervalued
CH
Community Contributor
Tesla’s Nvidia Moment – The AI & Robotics Inflection Point
Fair Value US$359.72|12.3% undervalued
BL
Community Contributor