
Advertisement
- Taiwan
- /
- Electrical
- /
- TWSE:1609
Did You Participate In Any Of Ta Ya Electric Wire & Cable's (TPE:1609) Incredible 393% Return?

We think all investors should try to buy and hold high quality multi-year winners. And we've seen some truly amazing gains over the years. For example, the Ta Ya Electric Wire & Cable (TPE:1609) share price is up a whopping 354% in the last half decade, a handsome return for long term holders. This just goes to show the value creation that some businesses can achieve. Meanwhile the share price is 2.6% higher than it was a week ago.
Check out our latest analysis for Ta Ya Electric Wire & Cable
To quote Buffett, 'Ships will sail around the world but the Flat Earth Society will flourish. There will continue to be wide discrepancies between price and value in the marketplace...' By comparing earnings per share (EPS) and share price changes over time, we can get a feel for how investor attitudes to a company have morphed over time.
During the last half decade, Ta Ya Electric Wire & Cable became profitable. That kind of transition can be an inflection point that justifies a strong share price gain, just as we have seen here. Since the company was unprofitable five years ago, but not three years ago, it's worth taking a look at the returns in the last three years, too. We can see that the Ta Ya Electric Wire & Cable share price is up 49% in the last three years. Meanwhile, EPS is up 26% per year. This EPS growth is higher than the 14% average annual increase in the share price over the same three years. Therefore, it seems the market has moderated its expectations for growth, somewhat.
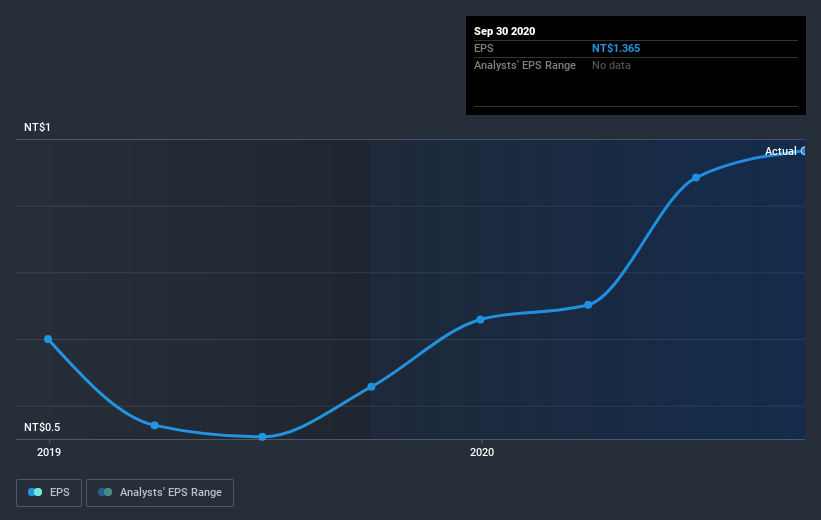
You can see below how EPS has changed over time (discover the exact values by clicking on the image).
Before buying or selling a stock, we always recommend a close examination of historic growth trends, available here.
What About Dividends?
As well as measuring the share price return, investors should also consider the total shareholder return (TSR). The TSR incorporates the value of any spin-offs or discounted capital raisings, along with any dividends, based on the assumption that the dividends are reinvested. So for companies that pay a generous dividend, the TSR is often a lot higher than the share price return. As it happens, Ta Ya Electric Wire & Cable's TSR for the last 5 years was 393%, which exceeds the share price return mentioned earlier. This is largely a result of its dividend payments!
A Different Perspective
We're pleased to report that Ta Ya Electric Wire & Cable shareholders have received a total shareholder return of 104% over one year. That's including the dividend. That's better than the annualised return of 38% over half a decade, implying that the company is doing better recently. Someone with an optimistic perspective could view the recent improvement in TSR as indicating that the business itself is getting better with time. It's always interesting to track share price performance over the longer term. But to understand Ta Ya Electric Wire & Cable better, we need to consider many other factors. Like risks, for instance. Every company has them, and we've spotted 2 warning signs for Ta Ya Electric Wire & Cable (of which 1 is concerning!) you should know about.
Of course, you might find a fantastic investment by looking elsewhere. So take a peek at this free list of companies we expect will grow earnings.
Please note, the market returns quoted in this article reflect the market weighted average returns of stocks that currently trade on TW exchanges.
If you’re looking to trade Ta Ya Electric Wire & Cable, open an account with the lowest-cost* platform trusted by professionals, Interactive Brokers. Their clients from over 200 countries and territories trade stocks, options, futures, forex, bonds and funds worldwide from a single integrated account. Promoted
Valuation is complex, but we're here to simplify it.
Discover if Ta Ya Electric Wire & Cable might be undervalued or overvalued with our detailed analysis, featuring fair value estimates, potential risks, dividends, insider trades, and its financial condition.
Access Free AnalysisThis article by Simply Wall St is general in nature. It does not constitute a recommendation to buy or sell any stock, and does not take account of your objectives, or your financial situation. We aim to bring you long-term focused analysis driven by fundamental data. Note that our analysis may not factor in the latest price-sensitive company announcements or qualitative material. Simply Wall St has no position in any stocks mentioned.
*Interactive Brokers Rated Lowest Cost Broker by StockBrokers.com Annual Online Review 2020
Have feedback on this article? Concerned about the content? Get in touch with us directly. Alternatively, email editorial-team (at) simplywallst.com.
About TWSE:1609
Ta Ya Electric Wire & Cable
Engages in the manufacture and sale of electric wires and cables in Taiwan and rest of Asia.
Mediocre balance sheet second-rate dividend payer.
Market Insights

Advertisement
Community Narratives
Groundbreaking therapies that could change the treatment landscape for PTSD, fibromyalgia, MS & Alzheimer’s
Fair Value US$6.20|86.9% undervalued
CM
Community Contributor
DigitalOcean Will Grow 14% by Embracing AI with Paperspace Acquisition
Fair Value US$50.00|41.7% undervalued
NE
Community Contributor
Viant Technology: A Rising AdTech Challenger in the AI-Powered CTV Market
Fair Value US$38.61|63.2% undervalued
BL
Community Contributor
Volvo will Accelerate Forward into Electric and Autonomous Leadership in Five Years
Fair Value SEK 438.80|39.7% undervalued
UN
Community Contributor