How Well Is QST International (GTSM:8349) Allocating Its Capital?


When we're researching a company, it's sometimes hard to find the warning signs, but there are some financial metrics that can help spot trouble early. Businesses in decline often have two underlying trends, firstly, a declining return on capital employed (ROCE) and a declining base of capital employed. This indicates to us that the business is not only shrinking the size of its net assets, but its returns are falling as well. And from a first read, things don't look too good at QST International (GTSM:8349), so let's see why.
Return On Capital Employed (ROCE): What is it?
For those who don't know, ROCE is a measure of a company's yearly pre-tax profit (its return), relative to the capital employed in the business. The formula for this calculation on QST International is:
Return on Capital Employed = Earnings Before Interest and Tax (EBIT) ÷ (Total Assets - Current Liabilities)
0.039 = NT$263m ÷ (NT$12b - NT$5.5b) (Based on the trailing twelve months to September 2020).
Thus, QST International has an ROCE of 3.9%. In absolute terms, that's a low return and it also under-performs the Machinery industry average of 9.3%.
See our latest analysis for QST International
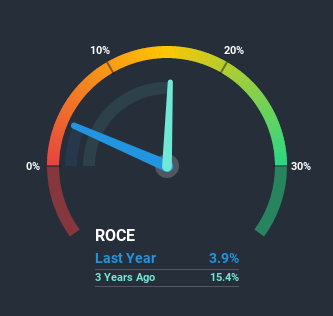
Historical performance is a great place to start when researching a stock so above you can see the gauge for QST International's ROCE against it's prior returns. If you're interested in investigating QST International's past further, check out this free graph of past earnings, revenue and cash flow.
How Are Returns Trending?
In terms of QST International's historical ROCE movements, the trend doesn't inspire confidence. Unfortunately the returns on capital have diminished from the 13% that they were earning five years ago. On top of that, it's worth noting that the amount of capital employed within the business has remained relatively steady. This combination can be indicative of a mature business that still has areas to deploy capital, but the returns received aren't as high due potentially to new competition or smaller margins. So because these trends aren't typically conducive to creating a multi-bagger, we wouldn't hold our breath on QST International becoming one if things continue as they have.
On a separate but related note, it's important to know that QST International has a current liabilities to total assets ratio of 45%, which we'd consider pretty high. This effectively means that suppliers (or short-term creditors) are funding a large portion of the business, so just be aware that this can introduce some elements of risk. Ideally we'd like to see this reduce as that would mean fewer obligations bearing risks.The Bottom Line On QST International's ROCE
In summary, it's unfortunate that QST International is generating lower returns from the same amount of capital. And long term shareholders have watched their investments stay flat over the last five years. With underlying trends that aren't great in these areas, we'd consider looking elsewhere.
QST International does come with some risks though, we found 5 warning signs in our investment analysis, and 2 of those are potentially serious...
While QST International isn't earning the highest return, check out this free list of companies that are earning high returns on equity with solid balance sheets.
If you’re looking to trade QST International, open an account with the lowest-cost* platform trusted by professionals, Interactive Brokers. Their clients from over 200 countries and territories trade stocks, options, futures, forex, bonds and funds worldwide from a single integrated account. Promoted
If you're looking to trade QST International, open an account with the lowest-cost platform trusted by professionals, Interactive Brokers.
With clients in over 200 countries and territories, and access to 160 markets, IBKR lets you trade stocks, options, futures, forex, bonds and funds from a single integrated account.
Enjoy no hidden fees, no account minimums, and FX conversion rates as low as 0.03%, far better than what most brokers offer.
Sponsored ContentValuation is complex, but we're here to simplify it.
Discover if QST International might be undervalued or overvalued with our detailed analysis, featuring fair value estimates, potential risks, dividends, insider trades, and its financial condition.
Access Free AnalysisThis article by Simply Wall St is general in nature. It does not constitute a recommendation to buy or sell any stock, and does not take account of your objectives, or your financial situation. We aim to bring you long-term focused analysis driven by fundamental data. Note that our analysis may not factor in the latest price-sensitive company announcements or qualitative material. Simply Wall St has no position in any stocks mentioned.
*Interactive Brokers Rated Lowest Cost Broker by StockBrokers.com Annual Online Review 2020
Have feedback on this article? Concerned about the content? Get in touch with us directly. Alternatively, email editorial-team@simplywallst.com.
About TPEX:8349
QST International
Manufactures and sells automotive fasteners and metal parts worldwide.
Solid track record with adequate balance sheet.
Market Insights

Community Narratives

