

When researching a stock for investment, what can tell us that the company is in decline? More often than not, we'll see a declining return on capital employed (ROCE) and a declining amount of capital employed. Trends like this ultimately mean the business is reducing its investments and also earning less on what it has invested. So after glancing at the trends within Buima Group (GTSM:5543), we weren't too hopeful.
Understanding Return On Capital Employed (ROCE)
If you haven't worked with ROCE before, it measures the 'return' (pre-tax profit) a company generates from capital employed in its business. The formula for this calculation on Buima Group is:
Return on Capital Employed = Earnings Before Interest and Tax (EBIT) ÷ (Total Assets - Current Liabilities)
0.04 = NT$33m ÷ (NT$1.5b - NT$689m) (Based on the trailing twelve months to September 2020).
So, Buima Group has an ROCE of 4.0%. Even though it's in line with the industry average of 4.2%, it's still a low return by itself.
Check out our latest analysis for Buima Group
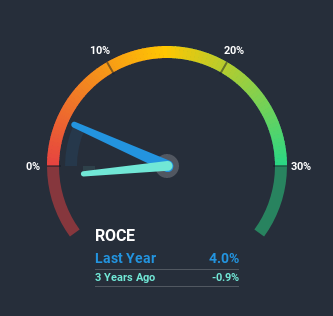
While the past is not representative of the future, it can be helpful to know how a company has performed historically, which is why we have this chart above. If you'd like to look at how Buima Group has performed in the past in other metrics, you can view this free graph of past earnings, revenue and cash flow.
What The Trend Of ROCE Can Tell Us
There is reason to be cautious about Buima Group, given the returns are trending downwards. Unfortunately the returns on capital have diminished from the 10% that they were earning five years ago. On top of that, it's worth noting that the amount of capital employed within the business has remained relatively steady. Companies that exhibit these attributes tend to not be shrinking, but they can be mature and facing pressure on their margins from competition. So because these trends aren't typically conducive to creating a multi-bagger, we wouldn't hold our breath on Buima Group becoming one if things continue as they have.
On a separate but related note, it's important to know that Buima Group has a current liabilities to total assets ratio of 45%, which we'd consider pretty high. This can bring about some risks because the company is basically operating with a rather large reliance on its suppliers or other sorts of short-term creditors. While it's not necessarily a bad thing, it can be beneficial if this ratio is lower.
The Bottom Line
All in all, the lower returns from the same amount of capital employed aren't exactly signs of a compounding machine. Since the stock has skyrocketed 201% over the last three years, it looks like investors have high expectations of the stock. In any case, the current underlying trends don't bode well for long term performance so unless they reverse, we'd start looking elsewhere.
If you want to know some of the risks facing Buima Group we've found 4 warning signs (2 are significant!) that you should be aware of before investing here.
While Buima Group may not currently earn the highest returns, we've compiled a list of companies that currently earn more than 25% return on equity. Check out this free list here.
If you’re looking to trade Buima Group, open an account with the lowest-cost* platform trusted by professionals, Interactive Brokers. Their clients from over 200 countries and territories trade stocks, options, futures, forex, bonds and funds worldwide from a single integrated account. Promoted
Valuation is complex, but we're here to simplify it.
Discover if Buima Group might be undervalued or overvalued with our detailed analysis, featuring fair value estimates, potential risks, dividends, insider trades, and its financial condition.
Access Free AnalysisThis article by Simply Wall St is general in nature. It does not constitute a recommendation to buy or sell any stock, and does not take account of your objectives, or your financial situation. We aim to bring you long-term focused analysis driven by fundamental data. Note that our analysis may not factor in the latest price-sensitive company announcements or qualitative material. Simply Wall St has no position in any stocks mentioned.
*Interactive Brokers Rated Lowest Cost Broker by StockBrokers.com Annual Online Review 2020
Have feedback on this article? Concerned about the content? Get in touch with us directly. Alternatively, email editorial-team (at) simplywallst.com.
About TPEX:5543
Buima Group
Manufactures and sells residential metal ceilings, metal partitions, and T-grids for supended ceilings in Mainland China, Taiwan, and internationally.
Slight and slightly overvalued.
Market Insights

Community Narratives


