- Taiwan
- /
- Construction
- /
- TPEX:5511
Here's What To Make Of Te Chang Construction's (GTSM:5511) Returns On Capital


Did you know there are some financial metrics that can provide clues of a potential multi-bagger? One common approach is to try and find a company with returns on capital employed (ROCE) that are increasing, in conjunction with a growing amount of capital employed. Basically this means that a company has profitable initiatives that it can continue to reinvest in, which is a trait of a compounding machine. However, after briefly looking over the numbers, we don't think Te Chang Construction (GTSM:5511) has the makings of a multi-bagger going forward, but let's have a look at why that may be.
What is Return On Capital Employed (ROCE)?
If you haven't worked with ROCE before, it measures the 'return' (pre-tax profit) a company generates from capital employed in its business. To calculate this metric for Te Chang Construction, this is the formula:
Return on Capital Employed = Earnings Before Interest and Tax (EBIT) ÷ (Total Assets - Current Liabilities)
0.083 = NT$370m ÷ (NT$9.0b - NT$4.5b) (Based on the trailing twelve months to September 2020).
So, Te Chang Construction has an ROCE of 8.3%. On its own, that's a low figure but it's around the 7.5% average generated by the Construction industry.
See our latest analysis for Te Chang Construction
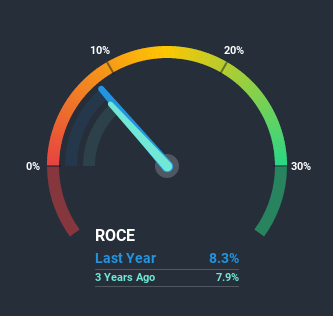
Historical performance is a great place to start when researching a stock so above you can see the gauge for Te Chang Construction's ROCE against it's prior returns. If you want to delve into the historical earnings, revenue and cash flow of Te Chang Construction, check out these free graphs here.
How Are Returns Trending?
On the surface, the trend of ROCE at Te Chang Construction doesn't inspire confidence. To be more specific, ROCE has fallen from 17% over the last five years. Given the business is employing more capital while revenue has slipped, this is a bit concerning. This could mean that the business is losing its competitive advantage or market share, because while more money is being put into ventures, it's actually producing a lower return - "less bang for their buck" per se.
On a separate but related note, it's important to know that Te Chang Construction has a current liabilities to total assets ratio of 50%, which we'd consider pretty high. This can bring about some risks because the company is basically operating with a rather large reliance on its suppliers or other sorts of short-term creditors. While it's not necessarily a bad thing, it can be beneficial if this ratio is lower.What We Can Learn From Te Chang Construction's ROCE
In summary, we're somewhat concerned by Te Chang Construction's diminishing returns on increasing amounts of capital. In spite of that, the stock has delivered a 38% return to shareholders who held over the last five years. Regardless, we don't like the trends as they are and if they persist, we think you might find better investments elsewhere.
One more thing to note, we've identified 1 warning sign with Te Chang Construction and understanding it should be part of your investment process.
For those who like to invest in solid companies, check out this free list of companies with solid balance sheets and high returns on equity.
When trading Te Chang Construction or any other investment, use the platform considered by many to be the Professional's Gateway to the Worlds Market, Interactive Brokers. You get the lowest-cost* trading on stocks, options, futures, forex, bonds and funds worldwide from a single integrated account. Promoted
If you're looking to trade Te Chang Construction, open an account with the lowest-cost platform trusted by professionals, Interactive Brokers.
With clients in over 200 countries and territories, and access to 160 markets, IBKR lets you trade stocks, options, futures, forex, bonds and funds from a single integrated account.
Enjoy no hidden fees, no account minimums, and FX conversion rates as low as 0.03%, far better than what most brokers offer.
Sponsored ContentValuation is complex, but we're here to simplify it.
Discover if Te Chang Construction might be undervalued or overvalued with our detailed analysis, featuring fair value estimates, potential risks, dividends, insider trades, and its financial condition.
Access Free AnalysisThis article by Simply Wall St is general in nature. It does not constitute a recommendation to buy or sell any stock, and does not take account of your objectives, or your financial situation. We aim to bring you long-term focused analysis driven by fundamental data. Note that our analysis may not factor in the latest price-sensitive company announcements or qualitative material. Simply Wall St has no position in any stocks mentioned.
*Interactive Brokers Rated Lowest Cost Broker by StockBrokers.com Annual Online Review 2020
Have feedback on this article? Concerned about the content? Get in touch with us directly. Alternatively, email editorial-team (at) simplywallst.com.
About TPEX:5511
Te Chang Construction
Engages in the construction contracting and civil engineering business in Taiwan and Thailand.
Excellent balance sheet established dividend payer.
Market Insights

Community Narratives

