
Advertisement

Investors can approximate the average market return by buying an index fund. But if you buy individual stocks, you can do both better or worse than that. Investors in Chaheng Precision Co., Ltd. (GTSM:4546) have tasted that bitter downside in the last year, as the share price dropped 53%. That contrasts poorly with the market return of 21%. To make matters worse, the returns over three years have also been really disappointing (the share price is 32% lower than three years ago). The silver lining is that the stock is up 3.1% in about a week.
Check out our latest analysis for Chaheng Precision
While the efficient markets hypothesis continues to be taught by some, it has been proven that markets are over-reactive dynamic systems, and investors are not always rational. By comparing earnings per share (EPS) and share price changes over time, we can get a feel for how investor attitudes to a company have morphed over time.
Unhappily, Chaheng Precision had to report a 76% decline in EPS over the last year. This fall in the EPS is significantly worse than the 53% the share price fall. It may have been that the weak EPS was not as bad as some had feared.
The image below shows how EPS has tracked over time (if you click on the image you can see greater detail).
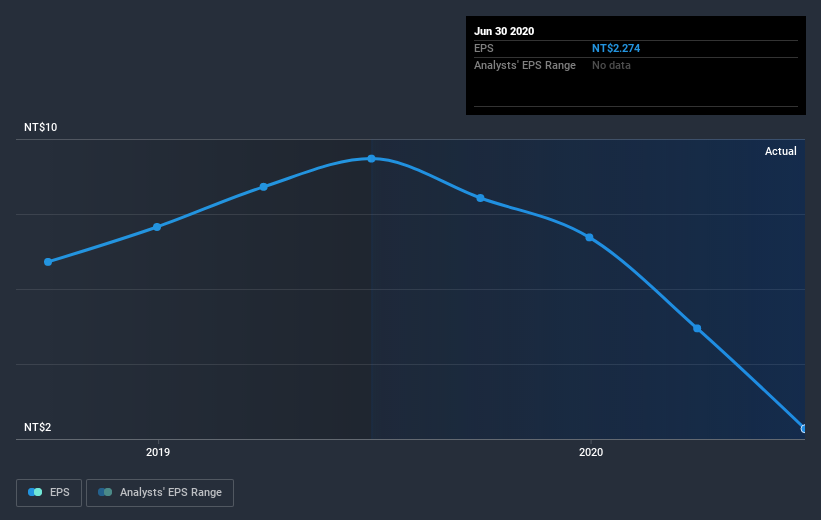
It might be well worthwhile taking a look at our free report on Chaheng Precision's earnings, revenue and cash flow.
What About Dividends?
When looking at investment returns, it is important to consider the difference between total shareholder return (TSR) and share price return. The TSR is a return calculation that accounts for the value of cash dividends (assuming that any dividend received was reinvested) and the calculated value of any discounted capital raisings and spin-offs. So for companies that pay a generous dividend, the TSR is often a lot higher than the share price return. In the case of Chaheng Precision, it has a TSR of -49% for the last year. That exceeds its share price return that we previously mentioned. The dividends paid by the company have thusly boosted the total shareholder return.
A Different Perspective
While the broader market gained around 21% in the last year, Chaheng Precision shareholders lost 49% (even including dividends). Even the share prices of good stocks drop sometimes, but we want to see improvements in the fundamental metrics of a business, before getting too interested. Longer term investors wouldn't be so upset, since they would have made 8%, each year, over five years. If the fundamental data continues to indicate long term sustainable growth, the current sell-off could be an opportunity worth considering. While it is well worth considering the different impacts that market conditions can have on the share price, there are other factors that are even more important. For example, we've discovered 4 warning signs for Chaheng Precision (1 is potentially serious!) that you should be aware of before investing here.
But note: Chaheng Precision may not be the best stock to buy. So take a peek at this free list of interesting companies with past earnings growth (and further growth forecast).
Please note, the market returns quoted in this article reflect the market weighted average returns of stocks that currently trade on TW exchanges.
If you decide to trade Chaheng Precision, use the lowest-cost* platform that is rated #1 Overall by Barron’s, Interactive Brokers. Trade stocks, options, futures, forex, bonds and funds on 135 markets, all from a single integrated account. Promoted
New: AI Stock Screener & Alerts
Our new AI Stock Screener scans the market every day to uncover opportunities.
• Dividend Powerhouses (3%+ Yield)
• Undervalued Small Caps with Insider Buying
• High growth Tech and AI Companies
Or build your own from over 50 metrics.
This article by Simply Wall St is general in nature. It does not constitute a recommendation to buy or sell any stock, and does not take account of your objectives, or your financial situation. We aim to bring you long-term focused analysis driven by fundamental data. Note that our analysis may not factor in the latest price-sensitive company announcements or qualitative material. Simply Wall St has no position in any stocks mentioned.
*Interactive Brokers Rated Lowest Cost Broker by StockBrokers.com Annual Online Review 2020
Have feedback on this article? Concerned about the content? Get in touch with us directly. Alternatively, email editorial-team@simplywallst.com.
About TPEX:4546
Chaheng Precision
Designs, manufactures, process, and trades aerospace industry components in the United States, France, Taiwan, the Mainland of China, and internationally.
Slightly overvalued with questionable track record.
Market Insights


Advertisement
Community Narratives
Alphabet: The Under-appreciated Compounder Hiding in Plain Sight
Fair Value US$282.83|31.8% undervalued
BL
Community Contributor
Planet Labs: At The Heart Of The Emerging New Space Boom
Fair Value US$11.31|44.7% undervalued
AN
Community Contributor
Exxon in Guyana 5 year forecast Low $135 to High $189
Fair Value US$189.00|40.9% undervalued
AG
Community Contributor