Sumeeko Industries Co., Ltd.'s (GTSM:2066) Dismal Stock Performance Reflects Weak Fundamentals


It is hard to get excited after looking at Sumeeko Industries' (GTSM:2066) recent performance, when its stock has declined 9.9% over the past three months. To decide if this trend could continue, we decided to look at its weak fundamentals as they shape the long-term market trends. Specifically, we decided to study Sumeeko Industries' ROE in this article.
Return on Equity or ROE is a test of how effectively a company is growing its value and managing investors’ money. In short, ROE shows the profit each dollar generates with respect to its shareholder investments.
Check out our latest analysis for Sumeeko Industries
How Do You Calculate Return On Equity?
Return on equity can be calculated by using the formula:
Return on Equity = Net Profit (from continuing operations) ÷ Shareholders' Equity
So, based on the above formula, the ROE for Sumeeko Industries is:
1.0% = NT$11m ÷ NT$1.1b (Based on the trailing twelve months to September 2020).
The 'return' is the profit over the last twelve months. Another way to think of that is that for every NT$1 worth of equity, the company was able to earn NT$0.01 in profit.
What Is The Relationship Between ROE And Earnings Growth?
Thus far, we have learned that ROE measures how efficiently a company is generating its profits. Depending on how much of these profits the company reinvests or "retains", and how effectively it does so, we are then able to assess a company’s earnings growth potential. Assuming everything else remains unchanged, the higher the ROE and profit retention, the higher the growth rate of a company compared to companies that don't necessarily bear these characteristics.
Sumeeko Industries' Earnings Growth And 1.0% ROE
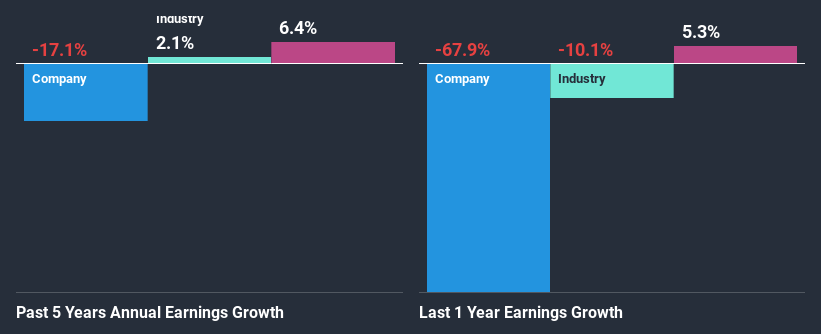
It is quite clear that Sumeeko Industries' ROE is rather low. Even compared to the average industry ROE of 9.8%, the company's ROE is quite dismal. Given the circumstances, the significant decline in net income by 17% seen by Sumeeko Industries over the last five years is not surprising. We believe that there also might be other aspects that are negatively influencing the company's earnings prospects. Such as - low earnings retention or poor allocation of capital.
However, when we compared Sumeeko Industries' growth with the industry we found that while the company's earnings have been shrinking, the industry has seen an earnings growth of 2.1% in the same period. This is quite worrisome.
The basis for attaching value to a company is, to a great extent, tied to its earnings growth. The investor should try to establish if the expected growth or decline in earnings, whichever the case may be, is priced in. By doing so, they will have an idea if the stock is headed into clear blue waters or if swampy waters await. If you're wondering about Sumeeko Industries''s valuation, check out this gauge of its price-to-earnings ratio, as compared to its industry.
Is Sumeeko Industries Using Its Retained Earnings Effectively?
Sumeeko Industries' declining earnings is not surprising given how the company is spending most of its profits in paying dividends, judging by its three-year median payout ratio of 65% (or a retention ratio of 35%). The business is only left with a small pool of capital to reinvest - A vicious cycle that doesn't benefit the company in the long-run. You can see the 5 risks we have identified for Sumeeko Industries by visiting our risks dashboard for free on our platform here.
Additionally, Sumeeko Industries has paid dividends over a period of nine years, which means that the company's management is rather focused on keeping up its dividend payments, regardless of the shrinking earnings.
Conclusion
In total, we would have a hard think before deciding on any investment action concerning Sumeeko Industries. The company has seen a lack of earnings growth as a result of retaining very little profits and whatever little it does retain, is being reinvested at a very low rate of return. Until now, we have only just grazed the surface of the company's past performance by looking at the company's fundamentals. You can do your own research on Sumeeko Industries and see how it has performed in the past by looking at this FREE detailed graph of past earnings, revenue and cash flows.
If you’re looking to trade Sumeeko Industries, open an account with the lowest-cost* platform trusted by professionals, Interactive Brokers. Their clients from over 200 countries and territories trade stocks, options, futures, forex, bonds and funds worldwide from a single integrated account. Promoted
If you're looking to trade Sumeeko Industries, open an account with the lowest-cost platform trusted by professionals, Interactive Brokers.
With clients in over 200 countries and territories, and access to 160 markets, IBKR lets you trade stocks, options, futures, forex, bonds and funds from a single integrated account.
Enjoy no hidden fees, no account minimums, and FX conversion rates as low as 0.03%, far better than what most brokers offer.
Sponsored ContentNew: Manage All Your Stock Portfolios in One Place
We've created the ultimate portfolio companion for stock investors, and it's free.
• Connect an unlimited number of Portfolios and see your total in one currency
• Be alerted to new Warning Signs or Risks via email or mobile
• Track the Fair Value of your stocks
This article by Simply Wall St is general in nature. It does not constitute a recommendation to buy or sell any stock, and does not take account of your objectives, or your financial situation. We aim to bring you long-term focused analysis driven by fundamental data. Note that our analysis may not factor in the latest price-sensitive company announcements or qualitative material. Simply Wall St has no position in any stocks mentioned.
*Interactive Brokers Rated Lowest Cost Broker by StockBrokers.com Annual Online Review 2020
Have feedback on this article? Concerned about the content? Get in touch with us directly. Alternatively, email editorial-team (at) simplywallst.com.
About TPEX:2066
Flawless balance sheet with questionable track record.
Market Insights

Community Narratives

