- Singapore
- /
- Marine and Shipping
- /
- SGX:S19
How Much Did Singapore Shipping's(SGX:S19) Shareholders Earn From Share Price Movements Over The Last Five Years?

In order to justify the effort of selecting individual stocks, it's worth striving to beat the returns from a market index fund. But the main game is to find enough winners to more than offset the losers At this point some shareholders may be questioning their investment in Singapore Shipping Corporation Limited (SGX:S19), since the last five years saw the share price fall 20%. It's down 2.0% in the last seven days.
View our latest analysis for Singapore Shipping
To paraphrase Benjamin Graham: Over the short term the market is a voting machine, but over the long term it's a weighing machine. One way to examine how market sentiment has changed over time is to look at the interaction between a company's share price and its earnings per share (EPS).
While the share price declined over five years, Singapore Shipping actually managed to increase EPS by an average of 1.4% per year. So it doesn't seem like EPS is a great guide to understanding how the market is valuing the stock. Or possibly, the market was previously very optimistic, so the stock has disappointed, despite improving EPS.
With EPS gaining and a declining share price, one would suggest the market is cooling on its view of the company. Having said that, if the EPS gains continue we'd expect the share price to improve, longer term.
You can see below how EPS has changed over time (discover the exact values by clicking on the image).
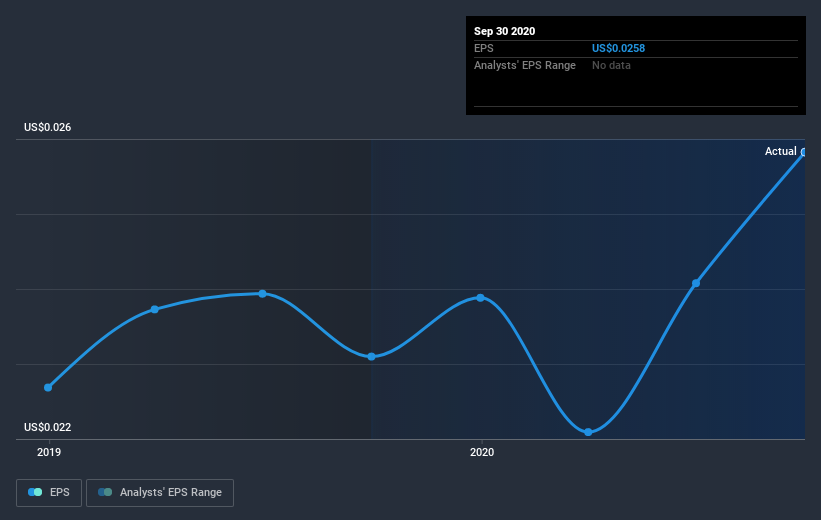
Dive deeper into Singapore Shipping's key metrics by checking this interactive graph of Singapore Shipping's earnings, revenue and cash flow.
What About Dividends?
When looking at investment returns, it is important to consider the difference between total shareholder return (TSR) and share price return. The TSR is a return calculation that accounts for the value of cash dividends (assuming that any dividend received was reinvested) and the calculated value of any discounted capital raisings and spin-offs. It's fair to say that the TSR gives a more complete picture for stocks that pay a dividend. In the case of Singapore Shipping, it has a TSR of -4.1% for the last 5 years. That exceeds its share price return that we previously mentioned. The dividends paid by the company have thusly boosted the total shareholder return.
A Different Perspective
We regret to report that Singapore Shipping shareholders are down 12% for the year (even including dividends). Unfortunately, that's worse than the broader market decline of 9.8%. However, it could simply be that the share price has been impacted by broader market jitters. It might be worth keeping an eye on the fundamentals, in case there's a good opportunity. Regrettably, last year's performance caps off a bad run, with the shareholders facing a total loss of 0.8% per year over five years. We realise that Baron Rothschild has said investors should "buy when there is blood on the streets", but we caution that investors should first be sure they are buying a high quality business. It's always interesting to track share price performance over the longer term. But to understand Singapore Shipping better, we need to consider many other factors. For instance, we've identified 2 warning signs for Singapore Shipping that you should be aware of.
But note: Singapore Shipping may not be the best stock to buy. So take a peek at this free list of interesting companies with past earnings growth (and further growth forecast).
Please note, the market returns quoted in this article reflect the market weighted average returns of stocks that currently trade on SG exchanges.
When trading Singapore Shipping or any other investment, use the platform considered by many to be the Professional's Gateway to the Worlds Market, Interactive Brokers. You get the lowest-cost* trading on stocks, options, futures, forex, bonds and funds worldwide from a single integrated account. Promoted
New: Manage All Your Stock Portfolios in One Place
We've created the ultimate portfolio companion for stock investors, and it's free.
• Connect an unlimited number of Portfolios and see your total in one currency
• Be alerted to new Warning Signs or Risks via email or mobile
• Track the Fair Value of your stocks
This article by Simply Wall St is general in nature. It does not constitute a recommendation to buy or sell any stock, and does not take account of your objectives, or your financial situation. We aim to bring you long-term focused analysis driven by fundamental data. Note that our analysis may not factor in the latest price-sensitive company announcements or qualitative material. Simply Wall St has no position in any stocks mentioned.
*Interactive Brokers Rated Lowest Cost Broker by StockBrokers.com Annual Online Review 2020
Have feedback on this article? Concerned about the content? Get in touch with us directly. Alternatively, email editorial-team@simplywallst.com.
About SGX:S19
Singapore Shipping
An investment holding company, owns and manages ships in Singapore, Japan, and internationally.
Flawless balance sheet, good value and pays a dividend.
Market Insights

Community Narratives

