
Advertisement
Here's How P/E Ratios Can Help Us Understand Excelpoint Technology Ltd. (SGX:BDF)
Want to participate in a short research study? Help shape the future of investing tools and you could win a $250 gift card!
Today, we'll introduce the concept of the P/E ratio for those who are learning about investing. We'll apply a basic P/E ratio analysis to Excelpoint Technology Ltd.'s (SGX:BDF), to help you decide if the stock is worth further research. Looking at earnings over the last twelve months, Excelpoint Technology has a P/E ratio of 5.74. That is equivalent to an earnings yield of about 17%.
See our latest analysis for Excelpoint Technology
How Do I Calculate A Price To Earnings Ratio?
The formula for P/E is:
Price to Earnings Ratio = Share Price (in reporting currency) ÷ Earnings per Share (EPS)
Or for Excelpoint Technology:
P/E of 5.74 = $0.37 (Note: this is the share price in the reporting currency, namely, USD ) ÷ $0.064 (Based on the trailing twelve months to March 2019.)
Is A High Price-to-Earnings Ratio Good?
A higher P/E ratio means that buyers have to pay a higher price for each SGD1 the company has earned over the last year. That isn't necessarily good or bad, but a high P/E implies relatively high expectations of what a company can achieve in the future.
How Growth Rates Impact P/E Ratios
P/E ratios primarily reflect market expectations around earnings growth rates. Earnings growth means that in the future the 'E' will be higher. That means unless the share price increases, the P/E will reduce in a few years. And as that P/E ratio drops, the company will look cheap, unless its share price increases.
Excelpoint Technology shrunk earnings per share by 7.2% last year. But it has grown its earnings per share by 1.3% per year over the last five years.
How Does Excelpoint Technology's P/E Ratio Compare To Its Peers?
The P/E ratio indicates whether the market has higher or lower expectations of a company. We can see in the image below that the average P/E (11.6) for companies in the electronic industry is higher than Excelpoint Technology's P/E.
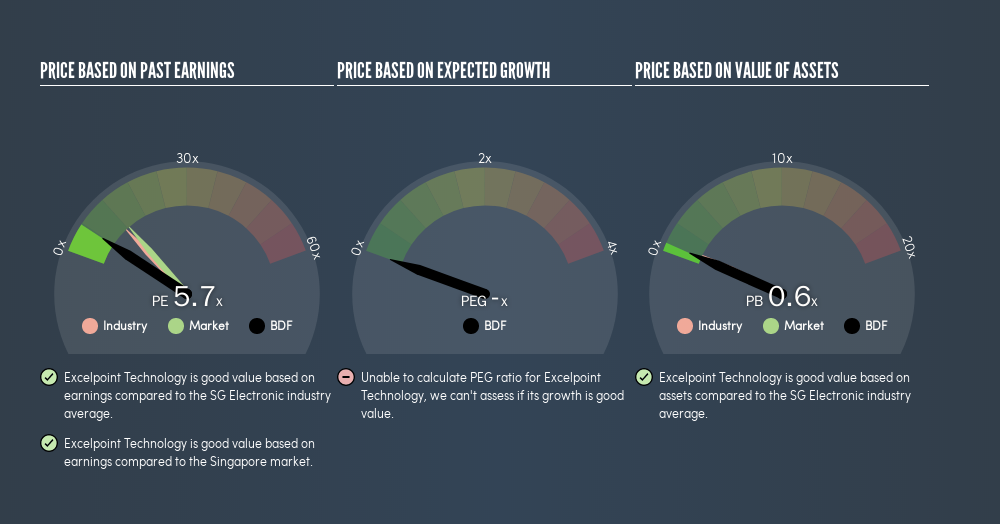
Excelpoint Technology's P/E tells us that market participants think it will not fare as well as its peers in the same industry. Since the market seems unimpressed with Excelpoint Technology, it's quite possible it could surprise on the upside. It is arguably worth checking if insiders are buying shares, because that might imply they believe the stock is undervalued.
Don't Forget: The P/E Does Not Account For Debt or Bank Deposits
The 'Price' in P/E reflects the market capitalization of the company. In other words, it does not consider any debt or cash that the company may have on the balance sheet. In theory, a company can lower its future P/E ratio by using cash or debt to invest in growth.
While growth expenditure doesn't always pay off, the point is that it is a good option to have; but one that the P/E ratio ignores.
How Does Excelpoint Technology's Debt Impact Its P/E Ratio?
Net debt totals a substantial 265% of Excelpoint Technology's market cap. If you want to compare its P/E ratio to other companies, you must keep in mind that these debt levels would usually warrant a relatively low P/E.
The Bottom Line On Excelpoint Technology's P/E Ratio
Excelpoint Technology trades on a P/E ratio of 5.7, which is below the SG market average of 12.6. The P/E reflects market pessimism that probably arises from the lack of recent EPS growth, paired with significant leverage.
Investors have an opportunity when market expectations about a stock are wrong. As value investor Benjamin Graham famously said, 'In the short run, the market is a voting machine but in the long run, it is a weighing machine.' Although we don't have analyst forecasts, you might want to assess this data-rich visualization of earnings, revenue and cash flow.
But note: Excelpoint Technology may not be the best stock to buy. So take a peek at this free list of interesting companies with strong recent earnings growth (and a P/E ratio below 20).
We aim to bring you long-term focused research analysis driven by fundamental data. Note that our analysis may not factor in the latest price-sensitive company announcements or qualitative material.
If you spot an error that warrants correction, please contact the editor at editorial-team@simplywallst.com. This article by Simply Wall St is general in nature. It does not constitute a recommendation to buy or sell any stock, and does not take account of your objectives, or your financial situation. Simply Wall St has no position in the stocks mentioned. Thank you for reading.
MI

The Foxhole
Google (GOOG) just paid US$10 million for a dead airline's emails. I think some companies are sitting on undervalued data goldmines, just waiting to strike a deal. But which can monetize it without going broke?
1110
PO
PowerLaw
Reddit is re-evaluating it's play here. It is worth watching. The consumers of data can also become competitors. It's a much bigger threat.
JA
jake_vw4g3
It only matters to a business if it can become a recurrent revenue stream. Mostly one off sales don't go anywhere.
About SGX:BDF
Excelpoint Technology
Excelpoint Technology Ltd., an investment holding company, provides electronic components, and engineering design, and supply chain management services.
Proven track record with adequate balance sheet.
Market Insights


Advertisement
Weekly Picks
RI


Rick_Orford on Starfighters Space ·
The 1960s Fighter Jet That Could Crack Open a $20 Billion Satellite Market
Fair Value:US$520.6% undervalued
53 followersusers have followed this narrative
2 commentsusers have commented on this narrative
7 likesusers have liked this narrative
JO


John_Eric on MercadoLibre ·
MercadoLibre and the Spreadsheet Trick That Decides Everything
Fair Value:US$7.31k73.9% undervalued
97 followersusers have followed this narrative
2 commentsusers have commented on this narrative
14 likesusers have liked this narrative
RC

rcb9 on PayPal Holdings ·
Ten Percent More Volume, One Percent More Transaction Margin
Fair Value:US$70.8913.6% undervalued
12 followersusers have followed this narrative
1 commentusers have commented on this narrative
5 likesusers have liked this narrative
HE


HedgeY on Micron Technology ·
Micron - The Memory Bottleneck Behind the AI Supercycle
Fair Value:US$1.25k25.0% undervalued
34 followersusers have followed this narrative
0 commentsusers have commented on this narrative
11 likesusers have liked this narrative
Recently Updated Narratives
JO

John_Eric on Betterware de MéxicoP.I. de ·
Only Two Analysts Cover This Stock.
Fair Value:US$59.672.9% undervalued
1 followerusers have followed this narrative
0 commentsusers have commented on this narrative
0 likesusers have liked this narrative
LU


LunaRodas on Jack Henry & Associates ·
JKHY | Jack Henry: What They Said vs. What They Did
Fair Value:US$163.690.4% undervalued
1 followerusers have followed this narrative
0 commentsusers have commented on this narrative
0 likesusers have liked this narrative
DA

david_1211213 on Lotus Technology ·
When History and Modern Collide, The Possibilities Expand for Lotus Technology Inc. (LOT)
Fair Value:US$4.576.9% undervalued
1 followerusers have followed this narrative
3 commentsusers have commented on this narrative
0 likesusers have liked this narrative
Popular Narratives
OS


oscargarcia on NVIDIA ·
The company that went from selling GPUs to gamers to becoming the AI arms dealer of the 21st century.
Fair Value:US$28022.3% undervalued
329 followersusers have followed this narrative
9 commentsusers have commented on this narrative
16 likesusers have liked this narrative
CU

CubanEros on Microsoft ·
A wonderful business at reasonable price.
Fair Value:US$419.9115.3% overvalued
182 followersusers have followed this narrative
0 commentsusers have commented on this narrative
9 likesusers have liked this narrative
KI

KiwiInvest on Amazon.com ·
Amazon's high growth, high tech segments propel its profits, while traditional segments plod along
Fair Value:US$475.0944.0% undervalued
207 followersusers have followed this narrative
1 commentusers have commented on this narrative
8 likesusers have liked this narrative
Trending Discussion
JA
james_rxfd8 on Starfighters Space ·
How is this different to Virgin Orbit, which didn’t seem to work out, with a very similar plan?
4
|2

