
Advertisement

Warren Buffett famously said, 'Volatility is far from synonymous with risk.' So it might be obvious that you need to consider debt, when you think about how risky any given stock is, because too much debt can sink a company. We note that SMI Vantage Limited (SGX:Y45) does have debt on its balance sheet. But the real question is whether this debt is making the company risky.
What Risk Does Debt Bring?
Debt is a tool to help businesses grow, but if a business is incapable of paying off its lenders, then it exists at their mercy. Ultimately, if the company can't fulfill its legal obligations to repay debt, shareholders could walk away with nothing. While that is not too common, we often do see indebted companies permanently diluting shareholders because lenders force them to raise capital at a distressed price. Of course, debt can be an important tool in businesses, particularly capital heavy businesses. The first thing to do when considering how much debt a business uses is to look at its cash and debt together.
Check out our latest analysis for SMI Vantage
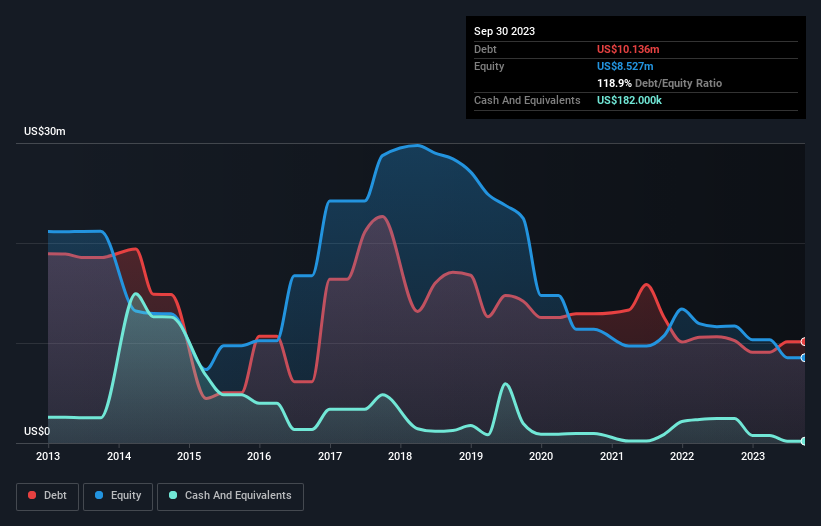
What Is SMI Vantage's Net Debt?
The chart below, which you can click on for greater detail, shows that SMI Vantage had US$10.1m in debt in September 2023; about the same as the year before. Net debt is about the same, since the it doesn't have much cash.
How Strong Is SMI Vantage's Balance Sheet?
According to the last reported balance sheet, SMI Vantage had liabilities of US$5.28m due within 12 months, and liabilities of US$10.5m due beyond 12 months. On the other hand, it had cash of US$182.0k and US$5.04m worth of receivables due within a year. So its liabilities outweigh the sum of its cash and (near-term) receivables by US$10.6m.
SMI Vantage has a market capitalization of US$20.3m, so it could very likely raise cash to ameliorate its balance sheet, if the need arose. However, it is still worthwhile taking a close look at its ability to pay off debt. When analysing debt levels, the balance sheet is the obvious place to start. But you can't view debt in total isolation; since SMI Vantage will need earnings to service that debt. So if you're keen to discover more about its earnings, it might be worth checking out this graph of its long term earnings trend.
Over 12 months, SMI Vantage reported revenue of US$2.3m, which is a gain of 310%, although it did not report any earnings before interest and tax. That's virtually the hole-in-one of revenue growth!
Caveat Emptor
Even though SMI Vantage managed to grow its top line quite deftly, the cold hard truth is that it is losing money on the EBIT line. Its EBIT loss was a whopping US$3.0m. Considering that alongside the liabilities mentioned above does not give us much confidence that company should be using so much debt. So we think its balance sheet is a little strained, though not beyond repair. Another cause for caution is that is bled US$2.4m in negative free cash flow over the last twelve months. So in short it's a really risky stock. When analysing debt levels, the balance sheet is the obvious place to start. However, not all investment risk resides within the balance sheet - far from it. To that end, you should learn about the 5 warning signs we've spotted with SMI Vantage (including 2 which are a bit unpleasant) .
If, after all that, you're more interested in a fast growing company with a rock-solid balance sheet, then check out our list of net cash growth stocks without delay.
New: Manage All Your Stock Portfolios in One Place
We've created the ultimate portfolio companion for stock investors, and it's free.
• Connect an unlimited number of Portfolios and see your total in one currency
• Be alerted to new Warning Signs or Risks via email or mobile
• Track the Fair Value of your stocks
Have feedback on this article? Concerned about the content? Get in touch with us directly. Alternatively, email editorial-team (at) simplywallst.com.
This article by Simply Wall St is general in nature. We provide commentary based on historical data and analyst forecasts only using an unbiased methodology and our articles are not intended to be financial advice. It does not constitute a recommendation to buy or sell any stock, and does not take account of your objectives, or your financial situation. We aim to bring you long-term focused analysis driven by fundamental data. Note that our analysis may not factor in the latest price-sensitive company announcements or qualitative material. Simply Wall St has no position in any stocks mentioned.
About SGX:Y45
SMI Vantage
An investment and management company, engages in the travel retail, food and beverage, logistics, and digital mining business in Singapore, Malaysia, and Myanmar.
Slight and slightly overvalued.
Market Insights

Advertisement
Community Narratives
Groundbreaking therapies that could change the treatment landscape for PTSD, fibromyalgia, MS & Alzheimer’s
Fair Value US$6.20|86.9% undervalued
CM
Community Contributor
DigitalOcean Will Grow 14% by Embracing AI with Paperspace Acquisition
Fair Value US$50.00|41.7% undervalued
NE
Community Contributor
Viant Technology: A Rising AdTech Challenger in the AI-Powered CTV Market
Fair Value US$38.61|63.2% undervalued
BL
Community Contributor
Volvo will Accelerate Forward into Electric and Autonomous Leadership in Five Years
Fair Value SEK 438.80|39.7% undervalued
UN
Community Contributor