
Advertisement
- Singapore
- /
- Real Estate
- /
- SGX:U14
These 4 Measures Indicate That UOL Group (SGX:U14) Is Using Debt Extensively

The external fund manager backed by Berkshire Hathaway's Charlie Munger, Li Lu, makes no bones about it when he says 'The biggest investment risk is not the volatility of prices, but whether you will suffer a permanent loss of capital.' So it might be obvious that you need to consider debt, when you think about how risky any given stock is, because too much debt can sink a company. We note that UOL Group Limited (SGX:U14) does have debt on its balance sheet. But is this debt a concern to shareholders?
When Is Debt Dangerous?
Debt is a tool to help businesses grow, but if a business is incapable of paying off its lenders, then it exists at their mercy. If things get really bad, the lenders can take control of the business. However, a more frequent (but still costly) occurrence is where a company must issue shares at bargain-basement prices, permanently diluting shareholders, just to shore up its balance sheet. Of course, plenty of companies use debt to fund growth, without any negative consequences. When we think about a company's use of debt, we first look at cash and debt together.
View our latest analysis for UOL Group
What Is UOL Group's Net Debt?
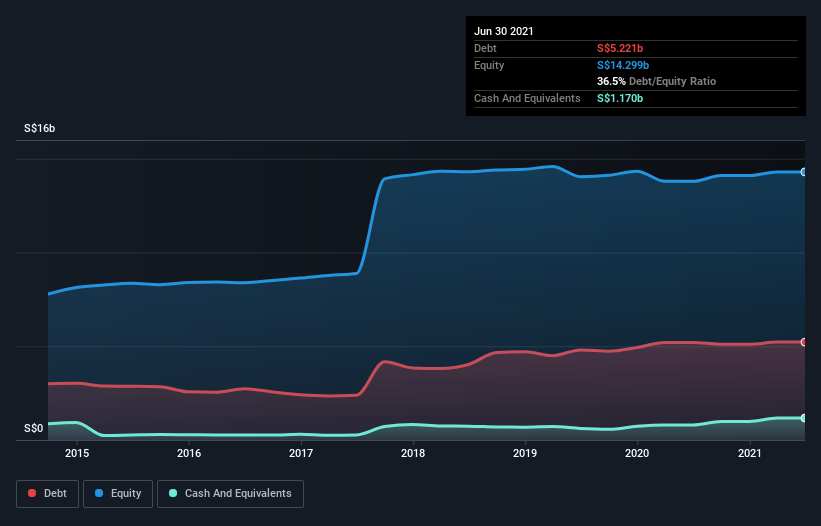
The chart below, which you can click on for greater detail, shows that UOL Group had S$5.22b in debt in June 2021; about the same as the year before. However, because it has a cash reserve of S$1.17b, its net debt is less, at about S$4.05b.
How Healthy Is UOL Group's Balance Sheet?
We can see from the most recent balance sheet that UOL Group had liabilities of S$3.09b falling due within a year, and liabilities of S$3.34b due beyond that. Offsetting this, it had S$1.17b in cash and S$2.96b in receivables that were due within 12 months. So its liabilities total S$2.30b more than the combination of its cash and short-term receivables.
UOL Group has a market capitalization of S$5.88b, so it could very likely raise cash to ameliorate its balance sheet, if the need arose. But it's clear that we should definitely closely examine whether it can manage its debt without dilution.
In order to size up a company's debt relative to its earnings, we calculate its net debt divided by its earnings before interest, tax, depreciation, and amortization (EBITDA) and its earnings before interest and tax (EBIT) divided by its interest expense (its interest cover). The advantage of this approach is that we take into account both the absolute quantum of debt (with net debt to EBITDA) and the actual interest expenses associated with that debt (with its interest cover ratio).
UOL Group's net debt to EBITDA ratio is 7.1 which suggests rather high debt levels, but its interest cover of 9.8 times suggests the debt is easily serviced. Our best guess is that the company does indeed have significant debt obligations. Unfortunately, UOL Group saw its EBIT slide 8.3% in the last twelve months. If earnings continue on that decline then managing that debt will be difficult like delivering hot soup on a unicycle. The balance sheet is clearly the area to focus on when you are analysing debt. But ultimately the future profitability of the business will decide if UOL Group can strengthen its balance sheet over time. So if you're focused on the future you can check out this free report showing analyst profit forecasts.
Finally, while the tax-man may adore accounting profits, lenders only accept cold hard cash. So it's worth checking how much of that EBIT is backed by free cash flow. In the last three years, UOL Group's free cash flow amounted to 38% of its EBIT, less than we'd expect. That weak cash conversion makes it more difficult to handle indebtedness.
Our View
UOL Group's net debt to EBITDA was a real negative on this analysis, although the other factors we considered cast it in a significantly better light. In particular, its interest cover was re-invigorating. Taking the abovementioned factors together we do think UOL Group's debt poses some risks to the business. So while that leverage does boost returns on equity, we wouldn't really want to see it increase from here. Over time, share prices tend to follow earnings per share, so if you're interested in UOL Group, you may well want to click here to check an interactive graph of its earnings per share history.
At the end of the day, it's often better to focus on companies that are free from net debt. You can access our special list of such companies (all with a track record of profit growth). It's free.
When trading UOL Group or any other investment, use the platform considered by many to be the Professional's Gateway to the Worlds Market, Interactive Brokers. You get the lowest-cost* trading on stocks, options, futures, forex, bonds and funds worldwide from a single integrated account. Promoted
New: AI Stock Screener & Alerts
Our new AI Stock Screener scans the market every day to uncover opportunities.
• Dividend Powerhouses (3%+ Yield)
• Undervalued Small Caps with Insider Buying
• High growth Tech and AI Companies
Or build your own from over 50 metrics.
This article by Simply Wall St is general in nature. We provide commentary based on historical data and analyst forecasts only using an unbiased methodology and our articles are not intended to be financial advice. It does not constitute a recommendation to buy or sell any stock, and does not take account of your objectives, or your financial situation. We aim to bring you long-term focused analysis driven by fundamental data. Note that our analysis may not factor in the latest price-sensitive company announcements or qualitative material. Simply Wall St has no position in any stocks mentioned.
*Interactive Brokers Rated Lowest Cost Broker by StockBrokers.com Annual Online Review 2020
Have feedback on this article? Concerned about the content? Get in touch with us directly. Alternatively, email editorial-team (at) simplywallst.com.
About SGX:U14
UOL Group
UOL Group Limited (UOL) is a leading Singapore-listed property and hospitality group with total assets of about $23 billion.
Undervalued established dividend payer.
Similar Companies
Market Insights


Advertisement
Community Narratives
A Quality Compounder Marked Down on Overblown Fears
Fair Value US$120.72|59.6% undervalued
BA
Community Contributor

Wyndham Continues Global Expansion with 19% Ancillary Revenue Growth
Fair Value US$105.80|20.1% undervalued
ZW
Community Contributor